
커뮤니티
부탁 드립니다.

2015-12-20 08:41:18
195
글번호 93613
첨부 이미지
그림1
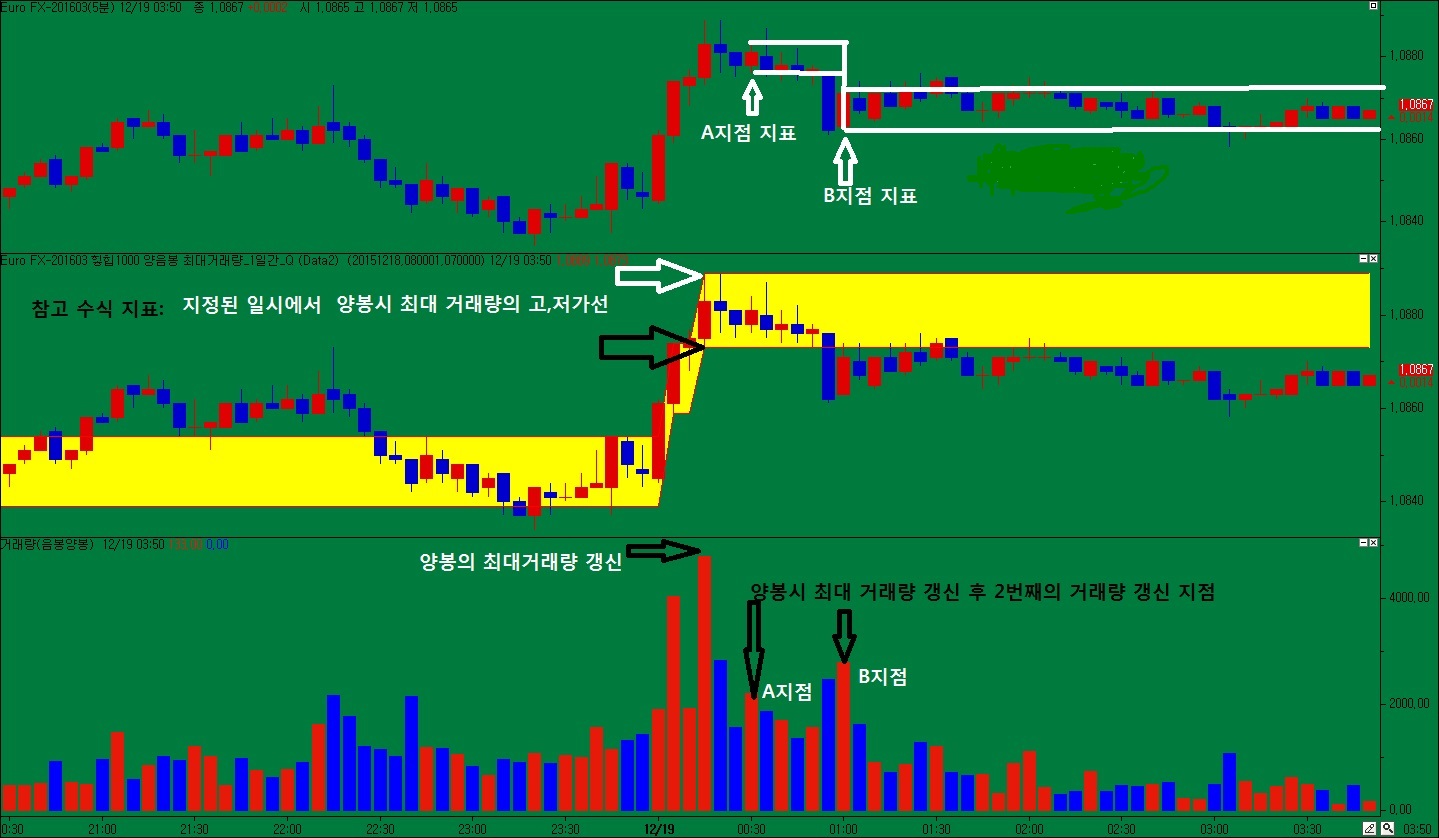
항상 도움 주셔서 진심으로 감사 드립니다.
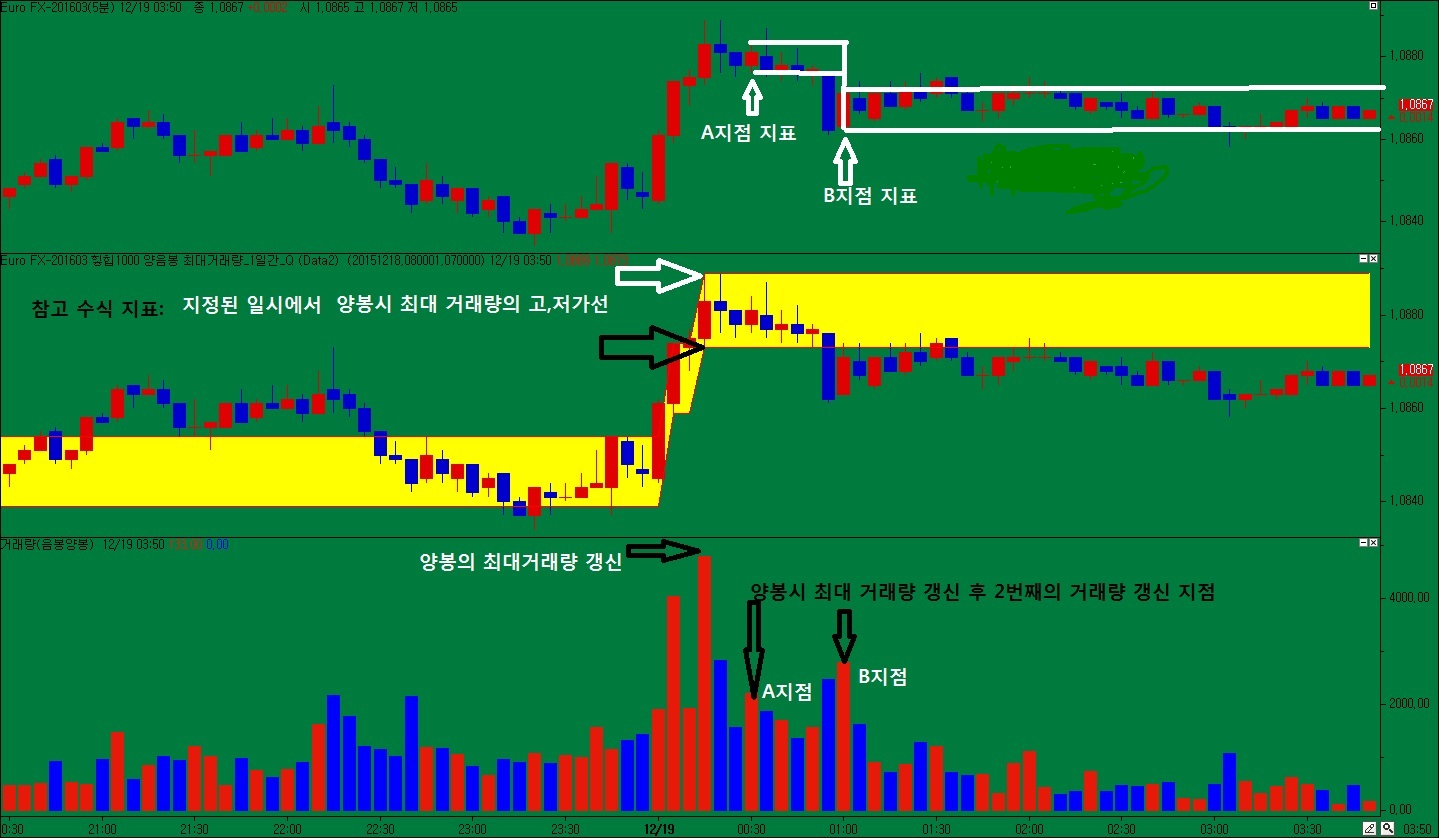
그림의 상단에 그린 지표와 같이
지정된 시간내에서
양봉시 최대 거래량 갱신 이후에
그것을 기준으로
양봉시 2번째의 최대 거래량을
갱신시마다 고저가선만 (A,B지점지표와 같이)
표시하고 싶습니다.
(최대 거래량은 지표에서 제외)
미리 감사와 경배 올립니다.
수정해야할 수식)
INPUT:일자(20151218),시작(080001),끝(070000);
var : HV1(0),idx(0),Hv2(0);
if sdate == 일자 and( stime == 시작 or (stime > 시작 and stime[1] < 시작)) Then{
Condition1 = true;
Condition2 = false;
Hv1 = V;
var1 = H;
var2 = L;
Hv2 = 0;
idx = 0;
}
if stime == 끝 or (stime > 끝 and stime[1] < 끝) Then
Condition1 = false;
if Condition1 == true Then{
idx = idx+1;
if idx >= 2 Then{
if V > HV1 Then{
Hv1 = V;
var1 = H;
var2 = L;
Hv2 = Hv1[1];
var3 = var1[1];
var4 = var2[1];
}
if V < HV1 and V > HV2 and V > Hv2 and C>=O Then{
Hv2 = V;
var3 = H;
var4 = L;
}
plot1(var3,"고가선");
plot2(var4,"저가선");
}
}
참고수식)_양봉시 최대 거래량의 고저가선
INPUT: 일자(20151218),시작(080001),끝(070000);
var :HV2(0),LV2(0);
if sdate == 일자 and( stime == 시작 or (stime > 시작 and stime[1] < 시작)) Then{
Condition2 = true;
Hv2 = 0;
}
if stime == 끝 or (stime > 끝 and stime[1] < 끝) Then
Condition2 = false;
if Condition2 == true and C >= O Then{
if V > HV2 Then{
Hv2 = V;
var11 = H;
var12 = L;
}
plot11(var11,"양봉고가");
plot12(var12,"양봉저가");
}
- 1. 1123Q.jpg (0.21 MB)
답변 3

예스스탁 예스스탁 답변
2015-12-21 12:28:54
안녕하세요
예스스탁입니다.
INPUT: 일자(20151218),시작(080001),끝(070000);
var : HV1(0), LV1(0),idx(0),Hv2(0);
if sdate == 일자 and( stime == 시작 or (stime > 시작 and stime[1] < 시작)) Then{
Hv1 = 0;
Hv2 = 0;
Condition1 = true;
Condition2 = false;
Condition3 = false;
}
if stime == 끝 or (stime > 끝 and stime[1] < 끝) Then
Condition1 = false;
if Condition1 == true Then{
if V > HV1 and C >= O Then{
Condition2 = true;
Hv1 = V;
var11 = H;
var12 = L;
Hv2 = 0;
}
if Hv1 > 0 and V < Hv1 and V > Hv2 and C >= O Then{
Condition3 = true;
Hv2 = V;
var21 = H;
var22 = L;
}
if Condition2 == true Then{
plot1(var11,"양봉고가1");
plot2(var12,"양봉저가2");
}
if Condition3 == true Then{
plot3(var21,"양봉고가2");
plot4(var22,"양봉저가2");
}
}
즐거운 하루되세요
> yes 님이 쓴 글입니다.
> 제목 : 부탁 드립니다.
> 항상 도움 주셔서 진심으로 감사 드립니다.
그림의 상단에 그린 지표와 같이
지정된 시간내에서
양봉시 최대 거래량 갱신 이후에
그것을 기준으로
양봉시 2번째의 최대 거래량을
갱신시마다 고저가선만 (A,B지점지표와 같이)
표시하고 싶습니다.
(최대 거래량은 지표에서 제외)
미리 감사와 경배 올립니다.
수정해야할 수식)
INPUT:일자(20151218),시작(080001),끝(070000);
var : HV1(0),idx(0),Hv2(0);
if sdate == 일자 and( stime == 시작 or (stime > 시작 and stime[1] < 시작)) Then{
Condition1 = true;
Condition2 = false;
Hv1 = V;
var1 = H;
var2 = L;
Hv2 = 0;
idx = 0;
}
if stime == 끝 or (stime > 끝 and stime[1] < 끝) Then
Condition1 = false;
if Condition1 == true Then{
idx = idx+1;
if idx >= 2 Then{
if V > HV1 Then{
Hv1 = V;
var1 = H;
var2 = L;
Hv2 = Hv1[1];
var3 = var1[1];
var4 = var2[1];
}
if V < HV1 and V > HV2 and V > Hv2 and C>=O Then{
Hv2 = V;
var3 = H;
var4 = L;
}
plot1(var3,"고가선");
plot2(var4,"저가선");
}
}
참고수식)_양봉시 최대 거래량의 고저가선
INPUT: 일자(20151218),시작(080001),끝(070000);
var :HV2(0),LV2(0);
if sdate == 일자 and( stime == 시작 or (stime > 시작 and stime[1] < 시작)) Then{
Condition2 = true;
Hv2 = 0;
}
if stime == 끝 or (stime > 끝 and stime[1] < 끝) Then
Condition2 = false;
if Condition2 == true and C >= O Then{
if V > HV2 Then{
Hv2 = V;
var11 = H;
var12 = L;
}
plot11(var11,"양봉고가");
plot12(var12,"양봉저가");
}
yes
2015-12-21 14:07:48
매우 만족한 수식 답변에 경배로 감사인사를 드립니다.
송구 스럽지만
추가로 부탁 드리고자 합니다.
양봉시 최고 거래량 갱신과
2번째 최고 거래량 갱신 이후에
(시작 시간부터 3번째가 아닌)
세번째 양봉 거래량의 고저가선을 아래와 같이 작성해보았으나
정상이 아닙니다.
수정 부탁 드릴까 합니다.
INPUT: 일자(20151218),시작(080001),끝(070000);
var : HV1(0), LV1(0),idx(0),Hv2(0),Hv3(0);
if sdate == 일자 and( stime == 시작 or (stime > 시작 and stime[1] < 시작)) Then{
Hv1 = 0;
Hv2 = 0;
Hv3 = 0;
Condition1 = true;
Condition2 = false;
Condition3 = false;
//이하추가
Condition4 = false;
//이상추가
}
if stime == 끝 or (stime > 끝 and stime[1] < 끝) Then
Condition1 = false;
if Condition1 == true Then{
if V > HV1 and C >= O Then{
Condition2 = true;
Hv1 = V;
var11 = H;
var12 = L;
Hv2 = 0;
}
if Hv1 > 0 and V < Hv1 and V > Hv2 and C >= O Then{
Condition3 = true;
Hv2 = V;
var21 = H;
var22 = L;
}
//이하 추가한 부분
if Hv1 > 0 and V < Hv1 and V < Hv2 and V > Hv3 and C >= O Then{
Condition4 = true;
Hv3 = V;
var31 = H;
var32 = L;
}
//이상 추가한 부분
if Condition2 == true Then{
plot1(var11,"양봉고가1");
plot2(var12,"양봉저가1");
}
if Condition3 == true Then{
plot3(var21,"양봉고가2");
plot4(var22,"양봉저가2");
}
//이하 추가한 부분
if Condition4 == true Then{
plot5(var31,"양봉3번째_고가");
plot6(var32,"양봉3번째_저가");
}
//이상 추가한 부분
}
> 예스스탁 님이 쓴 글입니다.
> 제목 : Re : 부탁 드립니다.
> 안녕하세요
예스스탁입니다.
INPUT: 일자(20151218),시작(080001),끝(070000);
var : HV1(0), LV1(0),idx(0),Hv2(0);
if sdate == 일자 and( stime == 시작 or (stime > 시작 and stime[1] < 시작)) Then{
Hv1 = 0;
Hv2 = 0;
Condition1 = true;
Condition2 = false;
Condition3 = false;
}
if stime == 끝 or (stime > 끝 and stime[1] < 끝) Then
Condition1 = false;
if Condition1 == true Then{
if V > HV1 and C >= O Then{
Condition2 = true;
Hv1 = V;
var11 = H;
var12 = L;
Hv2 = 0;
}
if Hv1 > 0 and V < Hv1 and V > Hv2 and C >= O Then{
Condition3 = true;
Hv2 = V;
var21 = H;
var22 = L;
}
if Condition2 == true Then{
plot1(var11,"양봉고가1");
plot2(var12,"양봉저가2");
}
if Condition3 == true Then{
plot3(var21,"양봉고가2");
plot4(var22,"양봉저가2");
}
}
즐거운 하루되세요
> yes 님이 쓴 글입니다.
> 제목 : 부탁 드립니다.
> 항상 도움 주셔서 진심으로 감사 드립니다.
그림의 상단에 그린 지표와 같이
지정된 시간내에서
양봉시 최대 거래량 갱신 이후에
그것을 기준으로
양봉시 2번째의 최대 거래량을
갱신시마다 고저가선만 (A,B지점지표와 같이)
표시하고 싶습니다.
(최대 거래량은 지표에서 제외)
미리 감사와 경배 올립니다.
수정해야할 수식)
INPUT:일자(20151218),시작(080001),끝(070000);
var : HV1(0),idx(0),Hv2(0);
if sdate == 일자 and( stime == 시작 or (stime > 시작 and stime[1] < 시작)) Then{
Condition1 = true;
Condition2 = false;
Hv1 = V;
var1 = H;
var2 = L;
Hv2 = 0;
idx = 0;
}
if stime == 끝 or (stime > 끝 and stime[1] < 끝) Then
Condition1 = false;
if Condition1 == true Then{
idx = idx+1;
if idx >= 2 Then{
if V > HV1 Then{
Hv1 = V;
var1 = H;
var2 = L;
Hv2 = Hv1[1];
var3 = var1[1];
var4 = var2[1];
}
if V < HV1 and V > HV2 and V > Hv2 and C>=O Then{
Hv2 = V;
var3 = H;
var4 = L;
}
plot1(var3,"고가선");
plot2(var4,"저가선");
}
}
참고수식)_양봉시 최대 거래량의 고저가선
INPUT: 일자(20151218),시작(080001),끝(070000);
var :HV2(0),LV2(0);
if sdate == 일자 and( stime == 시작 or (stime > 시작 and stime[1] < 시작)) Then{
Condition2 = true;
Hv2 = 0;
}
if stime == 끝 or (stime > 끝 and stime[1] < 끝) Then
Condition2 = false;
if Condition2 == true and C >= O Then{
if V > HV2 Then{
Hv2 = V;
var11 = H;
var12 = L;
}
plot11(var11,"양봉고가");
plot12(var12,"양봉저가");
}
예스스탁 예스스탁 답변
2015-12-21 14:10:04
안녕하세요
예스스탁입니다.
INPUT: 일자(20151218),시작(080001),끝(070000);
var : HV1(0), LV1(0),idx(0),Hv2(0),Hv3(0);
if sdate == 일자 and( stime == 시작 or (stime > 시작 and stime[1] < 시작)) Then{
Hv1 = 0;
Hv2 = 0;
Hv3 = 0;
Condition1 = true;
Condition2 = false;
Condition3 = false;
Condition4 = false;
}
if stime == 끝 or (stime > 끝 and stime[1] < 끝) Then
Condition1 = false;
if Condition1 == true Then{
if V > HV1 and C >= O Then{
Condition2 = true;
Hv1 = V;
var11 = H;
var12 = L;
Hv2 = 0;
Hv3 = 0;
}
if Hv1 > 0 and V < Hv1 and V > Hv2 and C >= O Then{
Condition3 = true;
Hv2 = V;
Hv3 = 0;
var21 = H;
var22 = L;
}
if Hv1 > 0 and Hv2 > 0 and V < Hv1 and V < Hv2 and V > Hv3 and C >= O Then{
Condition4 = true;
Hv3 = V;
var31 = H;
var32 = L;
}
if Condition2 == true Then{
plot1(var11,"양봉고가1");
plot2(var12,"양봉저가2");
}
if Condition3 == true Then{
plot3(var21,"양봉고가2");
plot4(var22,"양봉저가2");
}
if Condition4 == true Then{
plot5(var31,"양봉고가3");
plot6(var32,"양봉저가3");
}
}
즐거운 하루되세요
> yes 님이 쓴 글입니다.
> 제목 : Re : Re : 재 부탁 드립니다.
> 매우 만족한 수식 답변에 경배로 감사인사를 드립니다.
송구 스럽지만
추가로 부탁 드리고자 합니다.
양봉시 최고 거래량 갱신과
2번째 최고 거래량 갱신 이후에
(시작 시간부터 3번째가 아닌)
세번째 양봉 거래량의 고저가선을 아래와 같이 작성해보았으나
정상이 아닙니다.
수정 부탁 드릴까 합니다.
INPUT: 일자(20151218),시작(080001),끝(070000);
var : HV1(0), LV1(0),idx(0),Hv2(0),Hv3(0);
if sdate == 일자 and( stime == 시작 or (stime > 시작 and stime[1] < 시작)) Then{
Hv1 = 0;
Hv2 = 0;
Hv3 = 0;
Condition1 = true;
Condition2 = false;
Condition3 = false;
//이하추가
Condition4 = false;
//이상추가
}
if stime == 끝 or (stime > 끝 and stime[1] < 끝) Then
Condition1 = false;
if Condition1 == true Then{
if V > HV1 and C >= O Then{
Condition2 = true;
Hv1 = V;
var11 = H;
var12 = L;
Hv2 = 0;
}
if Hv1 > 0 and V < Hv1 and V > Hv2 and C >= O Then{
Condition3 = true;
Hv2 = V;
var21 = H;
var22 = L;
}
//이하 추가한 부분
if Hv1 > 0 and V < Hv1 and V < Hv2 and V > Hv3 and C >= O Then{
Condition4 = true;
Hv3 = V;
var31 = H;
var32 = L;
}
//이상 추가한 부분
if Condition2 == true Then{
plot1(var11,"양봉고가1");
plot2(var12,"양봉저가1");
}
if Condition3 == true Then{
plot3(var21,"양봉고가2");
plot4(var22,"양봉저가2");
}
//이하 추가한 부분
if Condition4 == true Then{
plot5(var31,"양봉3번째_고가");
plot6(var32,"양봉3번째_저가");
}
//이상 추가한 부분
}
> 예스스탁 님이 쓴 글입니다.
> 제목 : Re : 부탁 드립니다.
> 안녕하세요
예스스탁입니다.
INPUT: 일자(20151218),시작(080001),끝(070000);
var : HV1(0), LV1(0),idx(0),Hv2(0);
if sdate == 일자 and( stime == 시작 or (stime > 시작 and stime[1] < 시작)) Then{
Hv1 = 0;
Hv2 = 0;
Condition1 = true;
Condition2 = false;
Condition3 = false;
}
if stime == 끝 or (stime > 끝 and stime[1] < 끝) Then
Condition1 = false;
if Condition1 == true Then{
if V > HV1 and C >= O Then{
Condition2 = true;
Hv1 = V;
var11 = H;
var12 = L;
Hv2 = 0;
}
if Hv1 > 0 and V < Hv1 and V > Hv2 and C >= O Then{
Condition3 = true;
Hv2 = V;
var21 = H;
var22 = L;
}
if Condition2 == true Then{
plot1(var11,"양봉고가1");
plot2(var12,"양봉저가2");
}
if Condition3 == true Then{
plot3(var21,"양봉고가2");
plot4(var22,"양봉저가2");
}
}
즐거운 하루되세요
> yes 님이 쓴 글입니다.
> 제목 : 부탁 드립니다.
> 항상 도움 주셔서 진심으로 감사 드립니다.
그림의 상단에 그린 지표와 같이
지정된 시간내에서
양봉시 최대 거래량 갱신 이후에
그것을 기준으로
양봉시 2번째의 최대 거래량을
갱신시마다 고저가선만 (A,B지점지표와 같이)
표시하고 싶습니다.
(최대 거래량은 지표에서 제외)
미리 감사와 경배 올립니다.
수정해야할 수식)
INPUT:일자(20151218),시작(080001),끝(070000);
var : HV1(0),idx(0),Hv2(0);
if sdate == 일자 and( stime == 시작 or (stime > 시작 and stime[1] < 시작)) Then{
Condition1 = true;
Condition2 = false;
Hv1 = V;
var1 = H;
var2 = L;
Hv2 = 0;
idx = 0;
}
if stime == 끝 or (stime > 끝 and stime[1] < 끝) Then
Condition1 = false;
if Condition1 == true Then{
idx = idx+1;
if idx >= 2 Then{
if V > HV1 Then{
Hv1 = V;
var1 = H;
var2 = L;
Hv2 = Hv1[1];
var3 = var1[1];
var4 = var2[1];
}
if V < HV1 and V > HV2 and V > Hv2 and C>=O Then{
Hv2 = V;
var3 = H;
var4 = L;
}
plot1(var3,"고가선");
plot2(var4,"저가선");
}
}
참고수식)_양봉시 최대 거래량의 고저가선
INPUT: 일자(20151218),시작(080001),끝(070000);
var :HV2(0),LV2(0);
if sdate == 일자 and( stime == 시작 or (stime > 시작 and stime[1] < 시작)) Then{
Condition2 = true;
Hv2 = 0;
}
if stime == 끝 or (stime > 끝 and stime[1] < 끝) Then
Condition2 = false;
if Condition2 == true and C >= O Then{
if V > HV2 Then{
Hv2 = V;
var11 = H;
var12 = L;
}
plot11(var11,"양봉고가");
plot12(var12,"양봉저가");
}