
커뮤니티
부탁 드립니다.

2015-11-29 09:14:21
208
글번호 92862
첨부 이미지
그림1
항상 만족한 답변으로 도움주셔서 감사 드립니다.
미리 감사와 경배 올립니다.
질문1)
지정한 기간(p1)이 아닌
지정시간 사이의 조건에서만
양봉시 최대 거래량일때 고저선을 긋고 싶습니다.
(지정시간-> 21:30 ~익일07:00)
INPUT:P1(60);
var7=HIGHEST(IFF(C>O,V,0),P1);
if V==var7 then var1=H;
if V==var7 then var2=L;
plot1(var1,"고가선");
plot2(var2,"저가선");
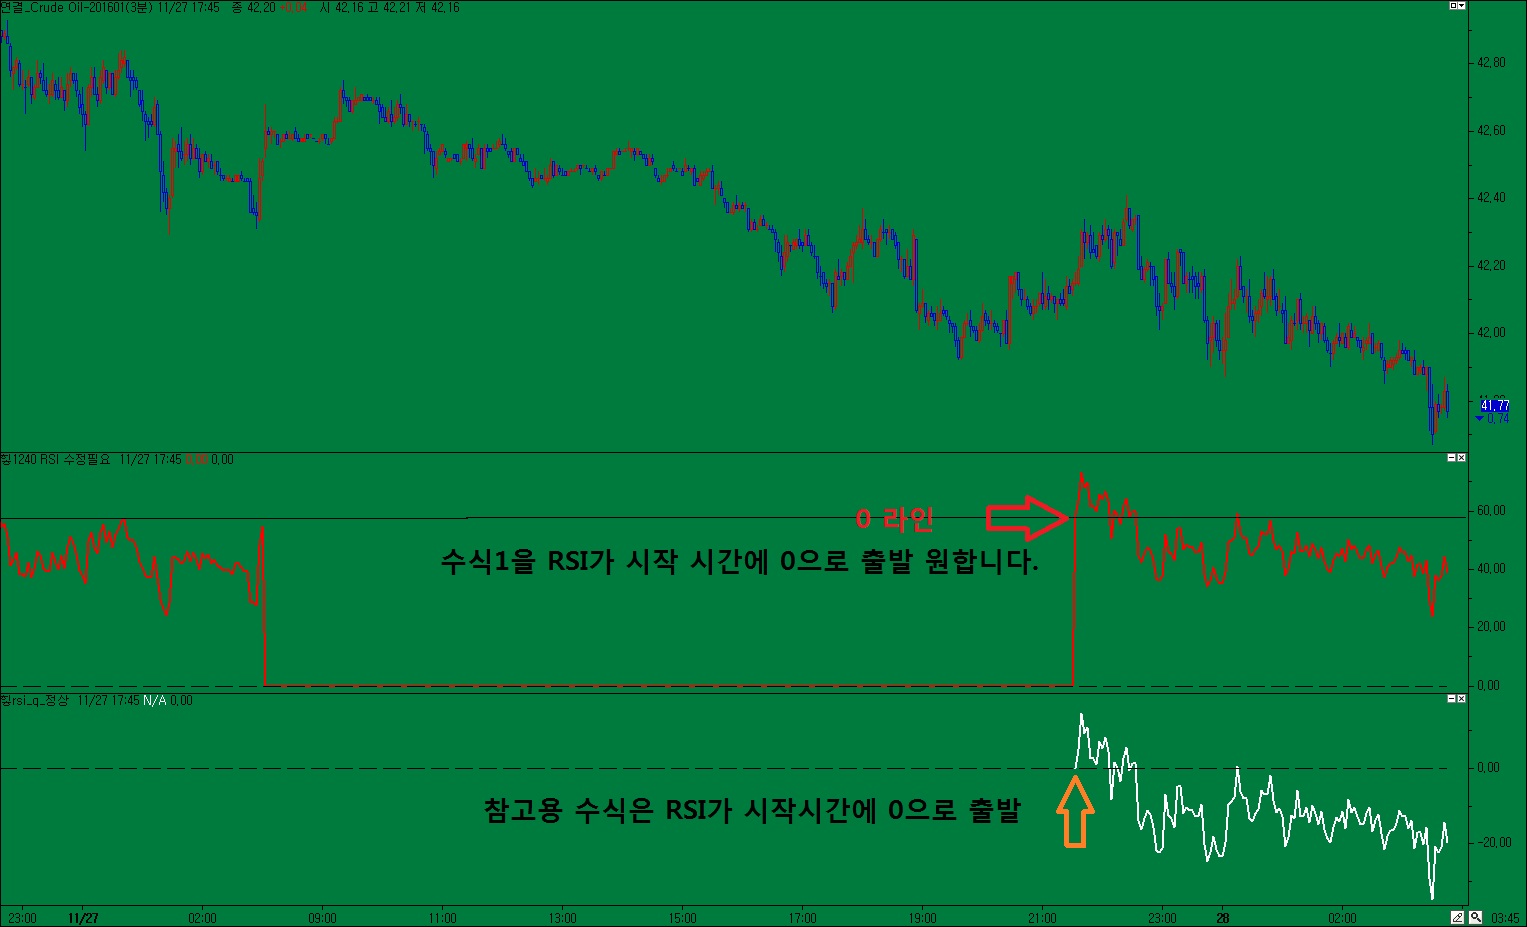
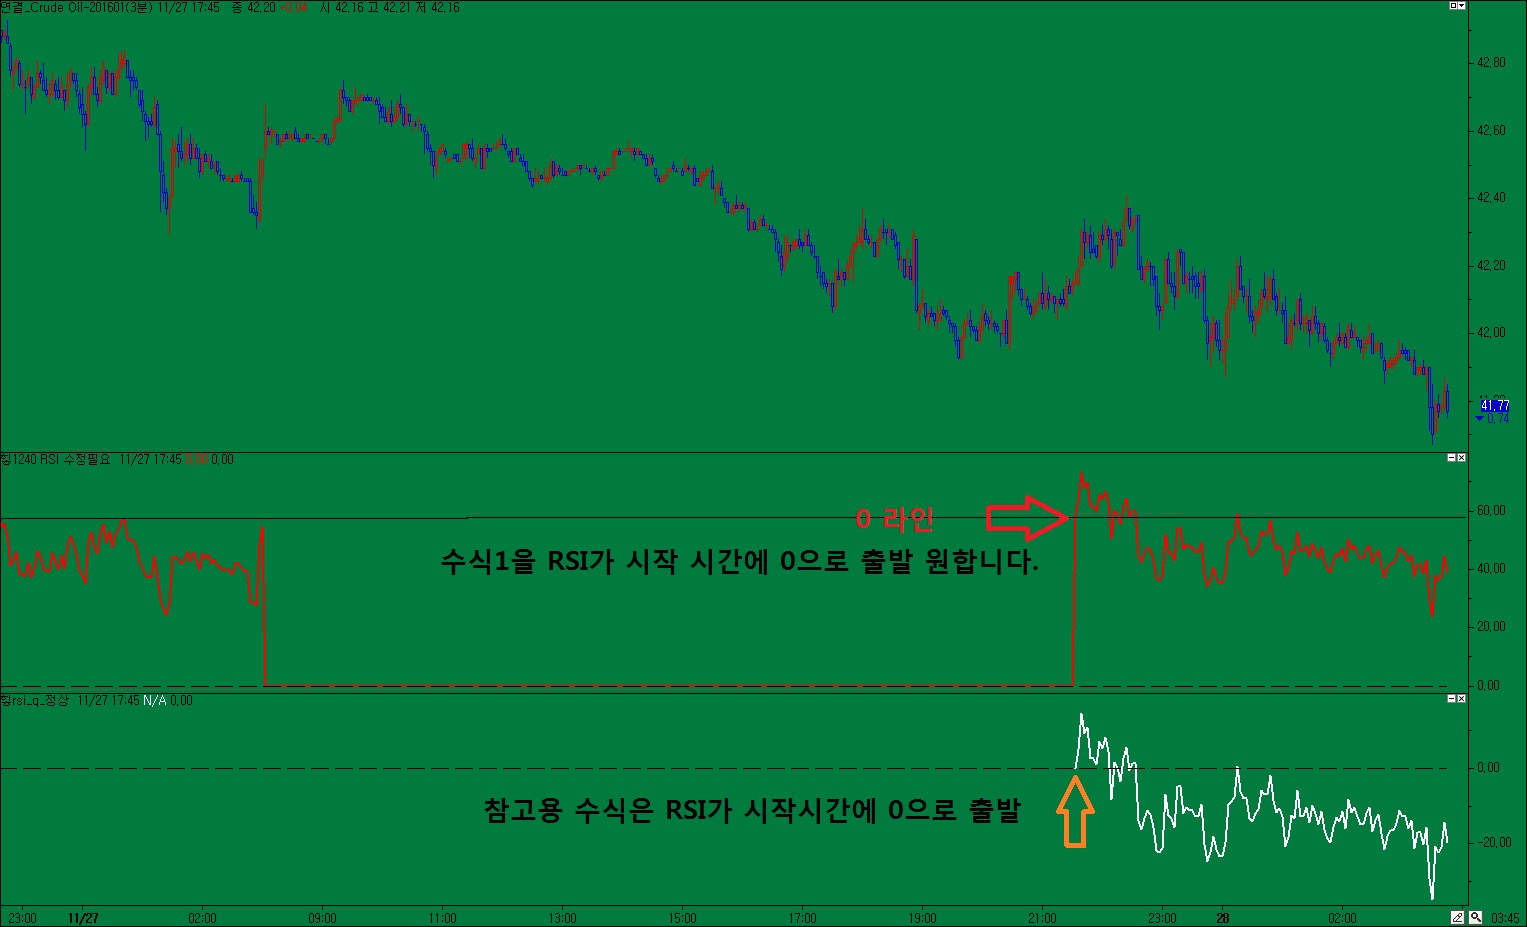
질문2)->그림참조
if stime >= 213000 or stime <= 070000 Then
var1 = rsi(14);
Else
var1 = 0;
plot1(var1);
PlotBaseLine1(0,"0");
참고용 수식)
var : diff04(0);
var : cond04(false);
if sdate == 20151127 and (stime == 213000 or (stime > 213000 and stime[1] < 213000)) then{
Cond04 = true;
var4 = RSI(14);
}
if sdate == 20151128 and (time == 070000 or (time > 070000 and time[1] < 070000)) then
Cond04 = false;
if sdate > 20151128 then
Cond04 = false;
if cond04 == true then{
diff04 = RSI(14)-var4;
plot4(diff04 ,"지표");
}
PlotBaseLine1(0,"0");
- 1. 2QQ.jpg (0.17 MB)
답변 2

예스스탁 예스스탁 답변
2015-11-30 11:47:36
안녕하세요
예스스탁입니다.
1.
INPUT:시작시간(213000),끝시간(070000);
var : HV(0);
if stime == 시작시간 or (stime > 시작시간 and stime[1] < 시작시간) Then{
Condition1 = true;
Hv = 0;
}
if stime == 끝시간 or (stime > 끝시간 and stime[1] < 끝시간) Then
Condition1 = true;
if Condition1 == true and V > HV Then{
Hv = V;
var1 = H;
var2 = L;
}
plot1(var1,"고가선");
plot2(var2,"저가선");
2.
INPUT:시작시간(213000),끝시간(070000);
Var : cond(false),V1(0);
if stime == 시작시간 or (stime > 시작시간 and stime[1] < 시작시간) then{
cond = true;
V1 = RSI(14);
}
if stime == 끝시간 or (stime > 끝시간 and stime[1] < 끝시간) Then
Cond = true;
if Cond == true Then
var1 = rsi(14)-V1;
Else
var1 = 0;
plot1(var1);
PlotBaseLine1(0,"0");
즐거운 하루되세요
> yes 님이 쓴 글입니다.
> 제목 : 부탁 드립니다.
> 항상 만족한 답변으로 도움주셔서 감사 드립니다.
미리 감사와 경배 올립니다.
질문1)
지정한 기간(p1)이 아닌
지정시간 사이의 조건에서만
양봉시 최대 거래량일때 고저선을 긋고 싶습니다.
(지정시간-> 21:30 ~익일07:00)
INPUT:P1(60);
var7=HIGHEST(IFF(C>O,V,0),P1);
if V==var7 then var1=H;
if V==var7 then var2=L;
plot1(var1,"고가선");
plot2(var2,"저가선");
질문2)->그림참조
if stime >= 213000 or stime <= 070000 Then
var1 = rsi(14);
Else
var1 = 0;
plot1(var1);
PlotBaseLine1(0,"0");
참고용 수식)
var : diff04(0);
var : cond04(false);
if sdate == 20151127 and (stime == 213000 or (stime > 213000 and stime[1] < 213000)) then{
Cond04 = true;
var4 = RSI(14);
}
if sdate == 20151128 and (time == 070000 or (time > 070000 and time[1] < 070000)) then
Cond04 = false;
if sdate > 20151128 then
Cond04 = false;
if cond04 == true then{
diff04 = RSI(14)-var4;
plot4(diff04 ,"지표");
}
PlotBaseLine1(0,"0");
yes
2015-12-02 09:01:44
답변에 감사드립니다.
답변수식1,2)에서
당일 08:00~21:30 (지정된 시간) 외에서는
지표를 그리고 싶지 않을시
어찌 하면 되는지요?
미리 감사 드립니다.
> 예스스탁 님이 쓴 글입니다.
> 제목 : Re : 부탁 드립니다.
> 안녕하세요
예스스탁입니다.
1.
INPUT:시작시간(213000),끝시간(070000);
var : HV(0);
if stime == 시작시간 or (stime > 시작시간 and stime[1] < 시작시간) Then{
Condition1 = true;
Hv = 0;
}
if stime == 끝시간 or (stime > 끝시간 and stime[1] < 끝시간) Then
Condition1 = true;
if Condition1 == true and V > HV Then{
Hv = V;
var1 = H;
var2 = L;
}
plot1(var1,"고가선");
plot2(var2,"저가선");
2.
INPUT:시작시간(213000),끝시간(070000);
Var : cond(false),V1(0);
if stime == 시작시간 or (stime > 시작시간 and stime[1] < 시작시간) then{
cond = true;
V1 = RSI(14);
}
if stime == 끝시간 or (stime > 끝시간 and stime[1] < 끝시간) Then
Cond = true;
if Cond == true Then
var1 = rsi(14)-V1;
Else
var1 = 0;
plot1(var1);
PlotBaseLine1(0,"0");
즐거운 하루되세요
> yes 님이 쓴 글입니다.
> 제목 : 부탁 드립니다.
> 항상 만족한 답변으로 도움주셔서 감사 드립니다.
미리 감사와 경배 올립니다.
질문1)
지정한 기간(p1)이 아닌
지정시간 사이의 조건에서만
양봉시 최대 거래량일때 고저선을 긋고 싶습니다.
(지정시간-> 21:30 ~익일07:00)
INPUT:P1(60);
var7=HIGHEST(IFF(C>O,V,0),P1);
if V==var7 then var1=H;
if V==var7 then var2=L;
plot1(var1,"고가선");
plot2(var2,"저가선");
질문2)->그림참조
if stime >= 213000 or stime <= 070000 Then
var1 = rsi(14);
Else
var1 = 0;
plot1(var1);
PlotBaseLine1(0,"0");
참고용 수식)
var : diff04(0);
var : cond04(false);
if sdate == 20151127 and (stime == 213000 or (stime > 213000 and stime[1] < 213000)) then{
Cond04 = true;
var4 = RSI(14);
}
if sdate == 20151128 and (time == 070000 or (time > 070000 and time[1] < 070000)) then
Cond04 = false;
if sdate > 20151128 then
Cond04 = false;
if cond04 == true then{
diff04 = RSI(14)-var4;
plot4(diff04 ,"지표");
}
PlotBaseLine1(0,"0");
다음글
이전글