
커뮤니티
부탁 드립니다.

2015-10-17 20:37:36
178
글번호 91387
첨부 이미지
그림1
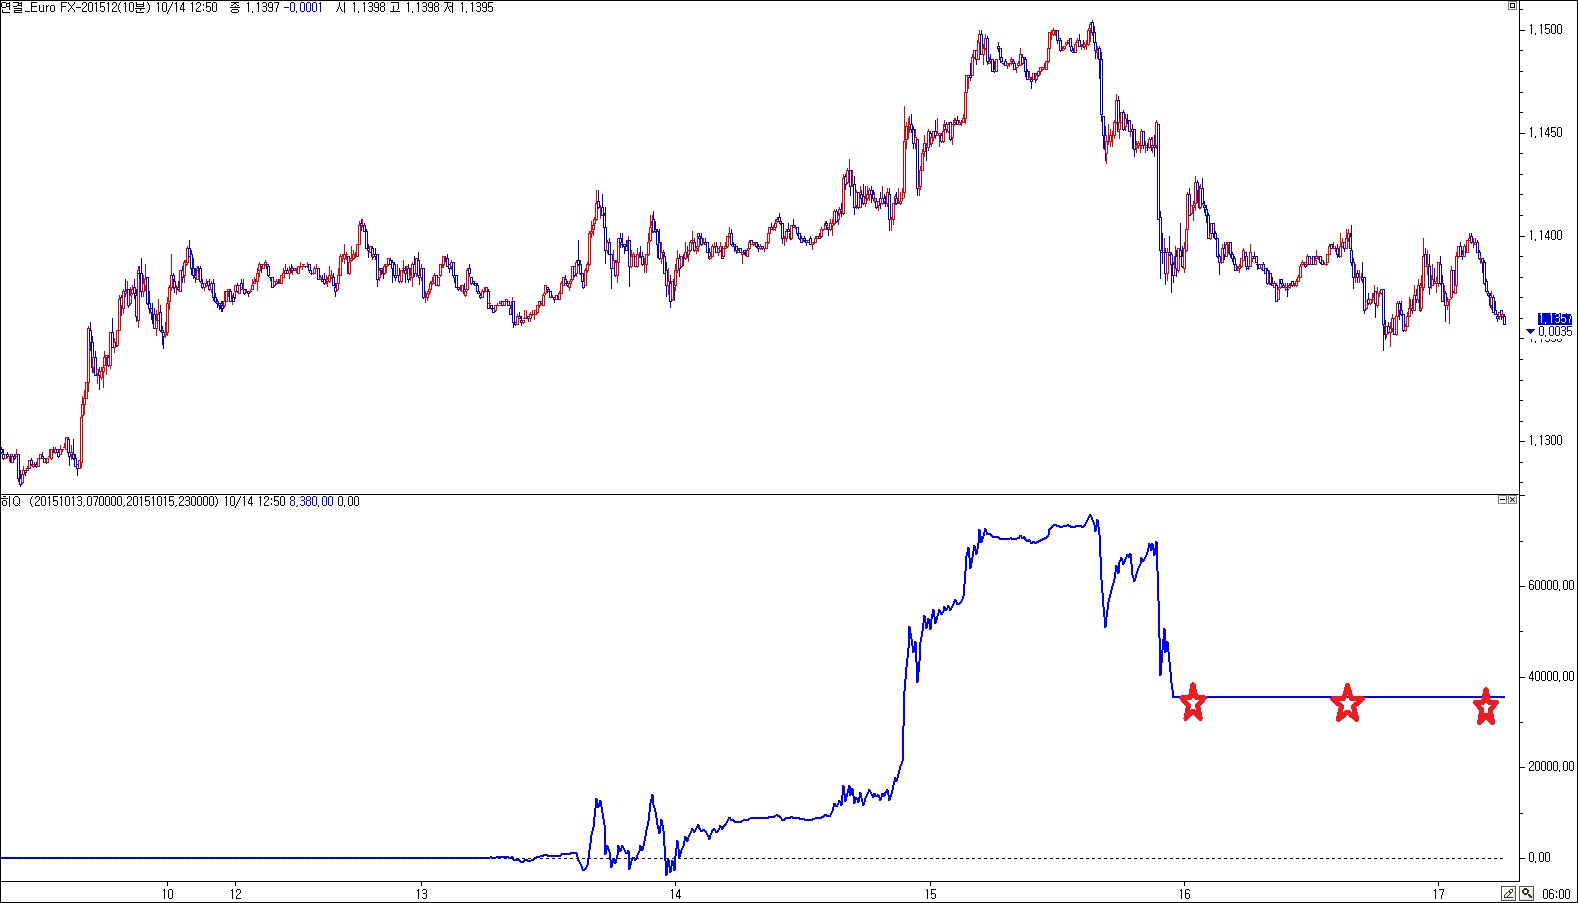
언제나 만족한 수식 답변에
깊히 감사 드립니다.
질문1)
아래 수식에서 종료시간에서
수평선이(적색 별표)
나오지 않게 부탁 드립니다.
질문2) 예를 들어 RSI(14)가
시작 시간에서
지표값을 0으로 하고
그 이후에만 지표를 만들고
종료일, 종료시간에 지표를 마치고 싶습니다.
미리 감사 드립니다.
input : 시작일(20151015),시작시간(190000);
input : 종료일(20151015),종료시간(230000);
var : cond(false);
if sdate == 시작일 and (stime == 시작시간 or (stime >시작시간 and stime[1] < 시작시간)) then
Cond = true;
if sdate == 종료일 and (time == 종료시간 or (time > 종료시간 and time[1] < 종료시간)) then
Cond = false;
if sdate > 종료일 then
Cond = false;
if cond == true then{
var1 = var1+(IFF(C>=O,V,0));
var2 = var2+(ifF(C<O,V,0));
VAR3 = VAR1 - VAR2;
}
plot10(var3,"var3");
PlotBaseLine1(0,"0");
- 1. 91904_Q.jpg (0.16 MB)
답변 1

예스스탁 예스스탁 답변
2015-10-19 10:50:59
안녕하세요
예스스탁입니다.
1.
input : 시작일(20151015),시작시간(190000);
input : 종료일(20151015),종료시간(230000);
var : cond(false);
if sdate == 시작일 and (stime == 시작시간 or (stime >시작시간 and stime[1] < 시작시간)) then
Cond = true;
if sdate == 종료일 and (time == 종료시간 or (time > 종료시간 and time[1] < 종료시간)) then
Cond = false;
if sdate > 종료일 then
Cond = false;
if cond == true then{
var1 = var1+(IFF(C>=O,V,0));
var2 = var2+(ifF(C<O,V,0));
VAR3 = VAR1 - VAR2;
plot10(var3,"var3");
PlotBaseLine1(0,"0");
}
2.
input : 시작일(20151015),시작시간(190000);
input : 종료일(20151015),종료시간(230000);
var : cond(false);
Inputs: Length(14);
Var : Counter(0), DownAmt(0), UpAmt(0), UpSum(0), DownSum(0), UpAvg(0), DownAvg(0);
var : RSIV(0),ii(0);
if sdate == 시작일 and (stime == 시작시간 or (stime >시작시간 and stime[1] < 시작시간)) then{
Cond = true;
ii = 0;
}
if sdate == 종료일 and (time == 종료시간 or (time > 종료시간 and time[1] < 종료시간)) then
Cond = false;
if sdate > 종료일 then
Cond = false;
if cond == true then{
ii = ii+1;
If ii == Length Then Begin
UpSum = 0;
DownSum = 0;
For Counter = 0 To Length - 1 Begin
UpAmt = C[Counter] - C[Counter+1];
If UpAmt >= 0 Then
DownAmt = 0;
Else Begin
DownAmt = -UpAmt;
UpAmt = 0;
End;
UpSum = UpSum + UpAmt;
DownSum = DownSum + DownAmt;
End;
UpAvg = UpSum / Length;
DownAvg = DownSum / Length;
End
Else If ii > Length AND Length > 0 Then Begin
UpAmt = C[0] - C[1];
If UpAmt >= 0 Then
DownAmt = 0;
Else Begin
DownAmt = -UpAmt;
UpAmt = 0;
End;
UpAvg = (UpAvg[1] * (Length - 1) + UpAmt) / Length;
DownAvg = (DownAvg[1] * (Length - 1) + DownAmt) / Length;
End;
If UpAvg + DownAvg <> 0 Then
RSIv = 100 * UpAvg / (UpAvg + DownAvg);
Else
RSIv = 0;
plot10(RSIV,"RSI");
}
즐거운 하루되세요
> yes 님이 쓴 글입니다.
> 제목 : 부탁 드립니다.
> 언제나 만족한 수식 답변에
깊히 감사 드립니다.
질문1)
아래 수식에서 종료시간에서
수평선이(적색 별표)
나오지 않게 부탁 드립니다.
질문2) 예를 들어 RSI(14)가
시작 시간에서
지표값을 0으로 하고
그 이후에만 지표를 만들고
종료일, 종료시간에 지표를 마치고 싶습니다.
미리 감사 드립니다.
input : 시작일(20151015),시작시간(190000);
input : 종료일(20151015),종료시간(230000);
var : cond(false);
if sdate == 시작일 and (stime == 시작시간 or (stime >시작시간 and stime[1] < 시작시간)) then
Cond = true;
if sdate == 종료일 and (time == 종료시간 or (time > 종료시간 and time[1] < 종료시간)) then
Cond = false;
if sdate > 종료일 then
Cond = false;
if cond == true then{
var1 = var1+(IFF(C>=O,V,0));
var2 = var2+(ifF(C<O,V,0));
VAR3 = VAR1 - VAR2;
}
plot10(var3,"var3");
PlotBaseLine1(0,"0");