
커뮤니티
지표문의

2015-10-16 11:15:14
327
글번호 91346
첨부 이미지
그림1
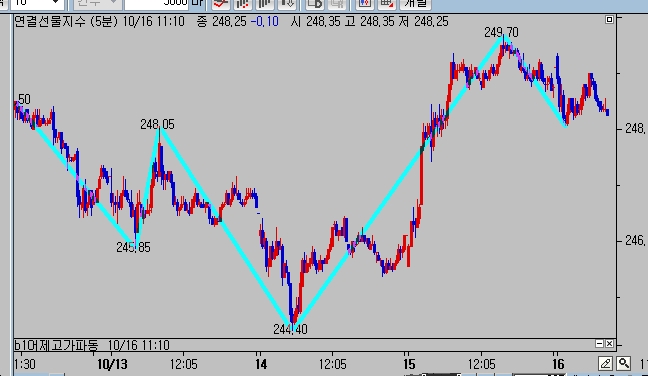
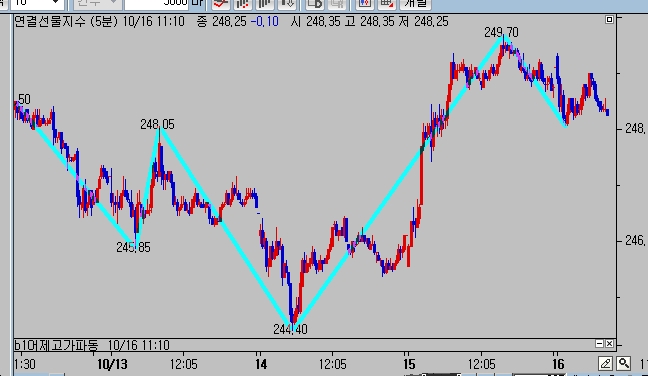
1.아래의 지표 수정 좀해주세요.
첨부 그림보면 파동 끝에 지수가 표현되는데
아래 지표두 그렇게 표시나게 고쳐주세요.
참고로 파동선끝에.추가로 다른것두 표시 할수 있나요(TL1,TL2) 그럼 같이 수정 좀해 주세요.
Input:Period(48),Rsi변동폭(10),Period1(10),Period2(5);
Var:j(0),상승(100),하락(-100),양방향(2),추세(0),
파동선(0),Rsi파동선(0),방향(0),RsiV(0),추세선(0),TL(0),TL1(0),TL2(0),tx(0);
Array:고[20](0),저[20](0),고Bar[20](0),저Bar[20](0),
Rsi고[20](0),Rsi저[20](0),Rsi고Bar[20](0),Rsi저Bar[20](0);
RsiV = rsi(Period);
#==========================================#
# 전고점,전저점 index 증가
#==========================================#
For j = 1 To 19
{
Rsi고Bar[j] = Rsi고Bar[j] + 1;
Rsi저Bar[j] = Rsi저Bar[j] + 1;
저Bar[j] = 저Bar[j] + 1;
고Bar[j] = 고Bar[j] + 1;
}
#==========================================#
# 최근 고,저 갱신
#==========================================#
If Rsi고[0] <= RsiV || Rsi고[0] == 0 || IsNaN(Rsi고[0]) == True Then
{
Rsi고[0] = RsiV;
Rsi고Bar[0] = 0;
}
Else
Rsi고Bar[0] = Rsi고Bar[0] + 1;
If Rsi저[0] >= RsiV || Rsi저[0] == 0 || IsNaN(Rsi저[0]) == True Then
{
Rsi저[0] = RsiV;
Rsi저Bar[0] = 0;
}
Else
Rsi저Bar[0] = Rsi저Bar[0] + 1;
If 고[0] <= H || 고[0] == 0 || IsNaN(고[0]) == True Then
{
고[0] = H;
고Bar[0] = 0;
}
Else
고Bar[0] = 고Bar[0] + 1;
If 저[0] >= L || 저[0] == 0 || IsNaN(저[0]) == True Then
{
저[0] = L;
저Bar[0] = 0;
}
Else
저Bar[0] = 저Bar[0] + 1;
#==========================================#
# 추세방향 결정
#==========================================#
If Rsi저[0][1] + Rsi변동폭 > RsiV[1] &&
Rsi저[0][1] + Rsi변동폭 <= RsiV Then 방향 = 상승;
If Rsi고[0][1] - Rsi변동폭 < RsiV[1] &&
Rsi고[0][1] - Rsi변동폭 >= RsiV Then 방향 = 하락;
#==========================================#
# 추세변화에 따른 변곡점 처리
#==========================================#
If 방향[1] == 하락 && 방향 == 상승 Then
{
For j = 18 DownTo 1
{
Rsi저[j+1] = Rsi저[j];
Rsi저Bar[j+1] = Rsi저Bar[j];
저[j+1] = 저[j];
저Bar[j+1] = 저Bar[j];
}
Rsi저[1] = Rsi저[0];
Rsi저Bar[1] = Rsi저Bar[0];
Rsi파동선 = Rsi저[0];
Rsi저[0] = RsiV;
Rsi저Bar[0] = 0;
Rsi고[0] = RsiV;
Rsi고Bar[0] = 0;
저[1] = 저[0];
저Bar[1] = 저Bar[0];
파동선 = 저[0];
저[0] = L;
저Bar[0] = 0;
고[0] = H;
고Bar[0] = 0;
plot2(파동선,"2",blue);
TL = TL_New(Sdate,stime,저[1],sdate[저bar[3]],stime[저bar[3]],저[3]);
TL_SetColor(TL,blue);
}
Else If 방향[1] == 상승 && 방향 == 하락 Then
{
For j = 18 DownTo 1
{
Rsi고[j+1] = Rsi고[j];
Rsi고Bar[j+1] = Rsi고Bar[j];
고[j+1] = 고[j];
고Bar[j+1] = 고Bar[j];
}
Rsi고[1] = Rsi고[0];
Rsi고Bar[1] = Rsi고Bar[0];
Rsi파동선 = Rsi고[0];
Rsi고[0] = RsiV;
Rsi고Bar[0] = 0;
Rsi저[0] = RsiV;
Rsi저Bar[0] = 0;
고[1] = 고[0];
고Bar[1] = 고Bar[0];
파동선 = 고[0];
고[0] = H;
고Bar[0] = 0;
저[0] = L;
저Bar[0] = 0;
plot3(파동선,"2",magenta);
TL = TL_New(Sdate,stime,고[1],sdate[고bar[3]],stime[고bar[3]],고[3]);
TL_SetColor(TL,RED);
}
Else If 방향[1] == 하락 && 방향 == 하락 Then
{
If Rsi고[1] < Rsi고[0] &&
Rsi고[0][1] - Rsi변동폭 <= RsiV[1] &&
Rsi고[0][1] - Rsi변동폭 > RsiV Then
{
Rsi고[1] = Rsi고[0];
Rsi고Bar[1] = Rsi고Bar[0];
Rsi파동선 = Rsi고[0];
Rsi고[0] = RsiV;
Rsi고Bar[0] = 0;
}
If 고[1] < 고[0] &&
고[0] > H Then
{
고[1] = 고[0];
고Bar[1] = 고Bar[0];
파동선 = 고[0];
고[0] = H;
고Bar[0] = 0;
}
}
Else If 방향[1] == 상승 && 방향 == 상승 Then
{
If Rsi저[1] > Rsi저[0] &&
Rsi저[0][1] + Rsi변동폭 >= RsiV[1] &&
Rsi저[0][1] + Rsi변동폭 < RsiV Then
{
Rsi저[1] = Rsi저[0];
Rsi저Bar[1] = Rsi저Bar[0];
Rsi파동선 = Rsi저[0];
Rsi저[0] = RsiV;
Rsi저Bar[0] = 0;
}
If 저[1] > 저[0] &&
저[0] < L Then
{
저[1] = 저[0];
저Bar[1] = 저Bar[0];
파동선 = 저[0];
저[0] = L;
저Bar[0] = 0;
}
}
#==========================================#
# 지표식 출력
#==========================================#
If Rsi파동선[1] != Rsi파동선 Then
Plot1(파동선,"주가파동선"); //적당껏 수평이동
Else If LastBarOnChart == 1 Then {
plot1(Iff(방향 == 상승,고[0],저[0]));
if 방향 == 상승 Then
plot3(고[0],"2",magenta);
if 방향 == 하락 Then
plot2(저[0],"2",blue);
}
TL_Delete(TL1);
TL_Delete(TL2);
if 방향 == 상승 then{
TL1 = TL_New(sdate[고bar[0]],sTime[고bar[0]],고[0],sdate,stime,고[0]);
TL2 = TL_New(sdate[저bar[1]],sTime[저bar[1]],저[1],sdate,stime,저[1]);
}
if 방향 == 하락 then{
TL1 = TL_New(sdate[고bar[1]],sTime[고bar[1]],고[1],sdate,stime,고[1]);
TL2 = TL_New(sdate[저bar[0]],sTime[저bar[0]],저[0],sdate,stime,저[0]);
}
TL_SetExtRight(TL1,true);
TL_SetExtRight(TL2,true);
2.그럼 즐거운 주말 되세요
- 1. 수치표시.jpg (0.10 MB)
답변 1

예스스탁 예스스탁 답변
2015-10-16 15:40:22
안녕하세요
예스스탁입니다.
Input:Period(48),Rsi변동폭(10),Period1(10),Period2(5);
Var:j(0),상승(100),하락(-100),양방향(2),추세(0),
파동선(0),Rsi파동선(0),방향(0),RsiV(0),추세선(0),TL(0),TL1(0),TL2(0),tx(0);
Array:고[20](0),저[20](0),고Bar[20](0),저Bar[20](0),
Rsi고[20](0),Rsi저[20](0),Rsi고Bar[20](0),Rsi저Bar[20](0);
RsiV = rsi(Period);
#==========================================#
# 전고점,전저점 index 증가
#==========================================#
For j = 1 To 19
{
Rsi고Bar[j] = Rsi고Bar[j] + 1;
Rsi저Bar[j] = Rsi저Bar[j] + 1;
저Bar[j] = 저Bar[j] + 1;
고Bar[j] = 고Bar[j] + 1;
}
#==========================================#
# 최근 고,저 갱신
#==========================================#
If Rsi고[0] <= RsiV || Rsi고[0] == 0 || IsNaN(Rsi고[0]) == True Then
{
Rsi고[0] = RsiV;
Rsi고Bar[0] = 0;
}
Else
Rsi고Bar[0] = Rsi고Bar[0] + 1;
If Rsi저[0] >= RsiV || Rsi저[0] == 0 || IsNaN(Rsi저[0]) == True Then
{
Rsi저[0] = RsiV;
Rsi저Bar[0] = 0;
}
Else
Rsi저Bar[0] = Rsi저Bar[0] + 1;
If 고[0] <= H || 고[0] == 0 || IsNaN(고[0]) == True Then
{
고[0] = H;
고Bar[0] = 0;
}
Else
고Bar[0] = 고Bar[0] + 1;
If 저[0] >= L || 저[0] == 0 || IsNaN(저[0]) == True Then
{
저[0] = L;
저Bar[0] = 0;
}
Else
저Bar[0] = 저Bar[0] + 1;
#==========================================#
# 추세방향 결정
#==========================================#
If Rsi저[0][1] + Rsi변동폭 > RsiV[1] &&
Rsi저[0][1] + Rsi변동폭 <= RsiV Then 방향 = 상승;
If Rsi고[0][1] - Rsi변동폭 < RsiV[1] &&
Rsi고[0][1] - Rsi변동폭 >= RsiV Then 방향 = 하락;
#==========================================#
# 추세변화에 따른 변곡점 처리
#==========================================#
If 방향[1] == 하락 && 방향 == 상승 Then
{
For j = 18 DownTo 1
{
Rsi저[j+1] = Rsi저[j];
Rsi저Bar[j+1] = Rsi저Bar[j];
저[j+1] = 저[j];
저Bar[j+1] = 저Bar[j];
}
Rsi저[1] = Rsi저[0];
Rsi저Bar[1] = Rsi저Bar[0];
Rsi파동선 = Rsi저[0];
Rsi저[0] = RsiV;
Rsi저Bar[0] = 0;
Rsi고[0] = RsiV;
Rsi고Bar[0] = 0;
저[1] = 저[0];
저Bar[1] = 저Bar[0];
파동선 = 저[0];
저[0] = L;
저Bar[0] = 0;
고[0] = H;
고Bar[0] = 0;
plot2(파동선,"2",blue);
TL = TL_New(Sdate,stime,저[1],sdate[저bar[3]],stime[저bar[3]],저[3]);
TL_SetColor(TL,blue);
}
Else If 방향[1] == 상승 && 방향 == 하락 Then
{
For j = 18 DownTo 1
{
Rsi고[j+1] = Rsi고[j];
Rsi고Bar[j+1] = Rsi고Bar[j];
고[j+1] = 고[j];
고Bar[j+1] = 고Bar[j];
}
Rsi고[1] = Rsi고[0];
Rsi고Bar[1] = Rsi고Bar[0];
Rsi파동선 = Rsi고[0];
Rsi고[0] = RsiV;
Rsi고Bar[0] = 0;
Rsi저[0] = RsiV;
Rsi저Bar[0] = 0;
고[1] = 고[0];
고Bar[1] = 고Bar[0];
파동선 = 고[0];
고[0] = H;
고Bar[0] = 0;
저[0] = L;
저Bar[0] = 0;
plot3(파동선,"2",magenta);
TL = TL_New(Sdate,stime,고[1],sdate[고bar[3]],stime[고bar[3]],고[3]);
TL_SetColor(TL,RED);
}
Else If 방향[1] == 하락 && 방향 == 하락 Then
{
If Rsi고[1] < Rsi고[0] &&
Rsi고[0][1] - Rsi변동폭 <= RsiV[1] &&
Rsi고[0][1] - Rsi변동폭 > RsiV Then
{
Rsi고[1] = Rsi고[0];
Rsi고Bar[1] = Rsi고Bar[0];
Rsi파동선 = Rsi고[0];
Rsi고[0] = RsiV;
Rsi고Bar[0] = 0;
}
If 고[1] < 고[0] &&
고[0] > H Then
{
고[1] = 고[0];
고Bar[1] = 고Bar[0];
파동선 = 고[0];
고[0] = H;
고Bar[0] = 0;
}
}
Else If 방향[1] == 상승 && 방향 == 상승 Then
{
If Rsi저[1] > Rsi저[0] &&
Rsi저[0][1] + Rsi변동폭 >= RsiV[1] &&
Rsi저[0][1] + Rsi변동폭 < RsiV Then
{
Rsi저[1] = Rsi저[0];
Rsi저Bar[1] = Rsi저Bar[0];
Rsi파동선 = Rsi저[0];
Rsi저[0] = RsiV;
Rsi저Bar[0] = 0;
}
If 저[1] > 저[0] &&
저[0] < L Then
{
저[1] = 저[0];
저Bar[1] = 저Bar[0];
파동선 = 저[0];
저[0] = L;
저Bar[0] = 0;
}
}
#==========================================#
# 지표식 출력
#==========================================#
If Rsi파동선[1] != Rsi파동선 Then
Plot1(파동선,"주가파동선"); //적당껏 수평이동
Else If LastBarOnChart == 1 Then {
plot1(Iff(방향 == 상승,고[0],저[0]));
if 방향 == 상승 Then
plot3(고[0],"2",magenta);
if 방향 == 하락 Then
plot2(저[0],"2",blue);
}
var : tx1(0),tx2(0),tx31(0),tx32(0),tx41(0),tx42(0);
TL_Delete(TL1);
TL_Delete(TL2);
Text_Delete(tx31);
Text_Delete(tx32);
Text_Delete(tx41);
Text_Delete(tx42);
if 방향 == 상승 then{
TL1 = TL_New(sdate[고bar[0]],sTime[고bar[0]],고[0],sdate,stime,고[0]);
TL2 = TL_New(sdate[저bar[1]],sTime[저bar[1]],저[1],sdate,stime,저[1]);
Tx31 = Text_New(sdate[고bar[0]],sTime[고bar[0]],고[0],NumToStr(고[0],2));
Tx32 = Text_New(sdate[저bar[1]],sTime[저bar[1]],저[1],NumToStr(저[1],2));
Text_SetColor(tx31,red);
Text_SetColor(tx32,BLUE);
Text_SetStyle(tx31,2,2);
Text_SetStyle(tx32,2,2);
}
if 방향 == 하락 then{
TL1 = TL_New(sdate[고bar[1]],sTime[고bar[1]],고[1],sdate,stime,고[1]);
TL2 = TL_New(sdate[저bar[0]],sTime[저bar[0]],저[0],sdate,stime,저[0]);
Tx41 = Text_New(sdate[고bar[1]],sTime[고bar[1]],고[1],NumToStr(고[1],2));
Tx42 = Text_New(sdate[저bar[0]],sTime[저bar[0]],저[0],NumToStr(저[0],2));
Text_SetColor(tx41,red);
Text_SetColor(tx42,blue);
Text_SetStyle(tx41,2,2);
Text_SetStyle(tx42,2,2);
}
TL_SetExtRight(TL1,true);
TL_SetExtRight(TL2,true);
if 방향 != 방향[1] and 방향 == 상승 Then{
Tx1 = Text_New(date[고bar[1]],sTime[고bar[1]],고[1],NumToStr(고[1],2));
Text_SetColor(tx1,red);
Text_SetStyle(tx1,2,2);
}
if 방향 != 방향[1] and 방향 == 하락 Then{
Tx2 = Text_New(date[저bar[1]],sTime[저bar[1]],저[1],NumToStr(저[1],2));
Text_SetColor(tx2,blue);
Text_SetStyle(tx2,2,2);
}
즐거운 하루되세요
> 성공예견 님이 쓴 글입니다.
> 제목 : 지표문의
> 1.아래의 지표 수정 좀해주세요.
첨부 그림보면 파동 끝에 지수가 표현되는데
아래 지표두 그렇게 표시나게 고쳐주세요.
참고로 파동선끝에.추가로 다른것두 표시 할수 있나요(TL1,TL2) 그럼 같이 수정 좀해 주세요.
Input:Period(48),Rsi변동폭(10),Period1(10),Period2(5);
Var:j(0),상승(100),하락(-100),양방향(2),추세(0),
파동선(0),Rsi파동선(0),방향(0),RsiV(0),추세선(0),TL(0),TL1(0),TL2(0),tx(0);
Array:고[20](0),저[20](0),고Bar[20](0),저Bar[20](0),
Rsi고[20](0),Rsi저[20](0),Rsi고Bar[20](0),Rsi저Bar[20](0);
RsiV = rsi(Period);
#==========================================#
# 전고점,전저점 index 증가
#==========================================#
For j = 1 To 19
{
Rsi고Bar[j] = Rsi고Bar[j] + 1;
Rsi저Bar[j] = Rsi저Bar[j] + 1;
저Bar[j] = 저Bar[j] + 1;
고Bar[j] = 고Bar[j] + 1;
}
#==========================================#
# 최근 고,저 갱신
#==========================================#
If Rsi고[0] <= RsiV || Rsi고[0] == 0 || IsNaN(Rsi고[0]) == True Then
{
Rsi고[0] = RsiV;
Rsi고Bar[0] = 0;
}
Else
Rsi고Bar[0] = Rsi고Bar[0] + 1;
If Rsi저[0] >= RsiV || Rsi저[0] == 0 || IsNaN(Rsi저[0]) == True Then
{
Rsi저[0] = RsiV;
Rsi저Bar[0] = 0;
}
Else
Rsi저Bar[0] = Rsi저Bar[0] + 1;
If 고[0] <= H || 고[0] == 0 || IsNaN(고[0]) == True Then
{
고[0] = H;
고Bar[0] = 0;
}
Else
고Bar[0] = 고Bar[0] + 1;
If 저[0] >= L || 저[0] == 0 || IsNaN(저[0]) == True Then
{
저[0] = L;
저Bar[0] = 0;
}
Else
저Bar[0] = 저Bar[0] + 1;
#==========================================#
# 추세방향 결정
#==========================================#
If Rsi저[0][1] + Rsi변동폭 > RsiV[1] &&
Rsi저[0][1] + Rsi변동폭 <= RsiV Then 방향 = 상승;
If Rsi고[0][1] - Rsi변동폭 < RsiV[1] &&
Rsi고[0][1] - Rsi변동폭 >= RsiV Then 방향 = 하락;
#==========================================#
# 추세변화에 따른 변곡점 처리
#==========================================#
If 방향[1] == 하락 && 방향 == 상승 Then
{
For j = 18 DownTo 1
{
Rsi저[j+1] = Rsi저[j];
Rsi저Bar[j+1] = Rsi저Bar[j];
저[j+1] = 저[j];
저Bar[j+1] = 저Bar[j];
}
Rsi저[1] = Rsi저[0];
Rsi저Bar[1] = Rsi저Bar[0];
Rsi파동선 = Rsi저[0];
Rsi저[0] = RsiV;
Rsi저Bar[0] = 0;
Rsi고[0] = RsiV;
Rsi고Bar[0] = 0;
저[1] = 저[0];
저Bar[1] = 저Bar[0];
파동선 = 저[0];
저[0] = L;
저Bar[0] = 0;
고[0] = H;
고Bar[0] = 0;
plot2(파동선,"2",blue);
TL = TL_New(Sdate,stime,저[1],sdate[저bar[3]],stime[저bar[3]],저[3]);
TL_SetColor(TL,blue);
}
Else If 방향[1] == 상승 && 방향 == 하락 Then
{
For j = 18 DownTo 1
{
Rsi고[j+1] = Rsi고[j];
Rsi고Bar[j+1] = Rsi고Bar[j];
고[j+1] = 고[j];
고Bar[j+1] = 고Bar[j];
}
Rsi고[1] = Rsi고[0];
Rsi고Bar[1] = Rsi고Bar[0];
Rsi파동선 = Rsi고[0];
Rsi고[0] = RsiV;
Rsi고Bar[0] = 0;
Rsi저[0] = RsiV;
Rsi저Bar[0] = 0;
고[1] = 고[0];
고Bar[1] = 고Bar[0];
파동선 = 고[0];
고[0] = H;
고Bar[0] = 0;
저[0] = L;
저Bar[0] = 0;
plot3(파동선,"2",magenta);
TL = TL_New(Sdate,stime,고[1],sdate[고bar[3]],stime[고bar[3]],고[3]);
TL_SetColor(TL,RED);
}
Else If 방향[1] == 하락 && 방향 == 하락 Then
{
If Rsi고[1] < Rsi고[0] &&
Rsi고[0][1] - Rsi변동폭 <= RsiV[1] &&
Rsi고[0][1] - Rsi변동폭 > RsiV Then
{
Rsi고[1] = Rsi고[0];
Rsi고Bar[1] = Rsi고Bar[0];
Rsi파동선 = Rsi고[0];
Rsi고[0] = RsiV;
Rsi고Bar[0] = 0;
}
If 고[1] < 고[0] &&
고[0] > H Then
{
고[1] = 고[0];
고Bar[1] = 고Bar[0];
파동선 = 고[0];
고[0] = H;
고Bar[0] = 0;
}
}
Else If 방향[1] == 상승 && 방향 == 상승 Then
{
If Rsi저[1] > Rsi저[0] &&
Rsi저[0][1] + Rsi변동폭 >= RsiV[1] &&
Rsi저[0][1] + Rsi변동폭 < RsiV Then
{
Rsi저[1] = Rsi저[0];
Rsi저Bar[1] = Rsi저Bar[0];
Rsi파동선 = Rsi저[0];
Rsi저[0] = RsiV;
Rsi저Bar[0] = 0;
}
If 저[1] > 저[0] &&
저[0] < L Then
{
저[1] = 저[0];
저Bar[1] = 저Bar[0];
파동선 = 저[0];
저[0] = L;
저Bar[0] = 0;
}
}
#==========================================#
# 지표식 출력
#==========================================#
If Rsi파동선[1] != Rsi파동선 Then
Plot1(파동선,"주가파동선"); //적당껏 수평이동
Else If LastBarOnChart == 1 Then {
plot1(Iff(방향 == 상승,고[0],저[0]));
if 방향 == 상승 Then
plot3(고[0],"2",magenta);
if 방향 == 하락 Then
plot2(저[0],"2",blue);
}
TL_Delete(TL1);
TL_Delete(TL2);
if 방향 == 상승 then{
TL1 = TL_New(sdate[고bar[0]],sTime[고bar[0]],고[0],sdate,stime,고[0]);
TL2 = TL_New(sdate[저bar[1]],sTime[저bar[1]],저[1],sdate,stime,저[1]);
}
if 방향 == 하락 then{
TL1 = TL_New(sdate[고bar[1]],sTime[고bar[1]],고[1],sdate,stime,고[1]);
TL2 = TL_New(sdate[저bar[0]],sTime[저bar[0]],저[0],sdate,stime,저[0]);
}
TL_SetExtRight(TL1,true);
TL_SetExtRight(TL2,true);
2.그럼 즐거운 주말 되세요
다음글
이전글