
커뮤니티
41633 질문 했었는데요..

2015-05-04 12:31:57
218
글번호 85665
첨부 이미지
그림1
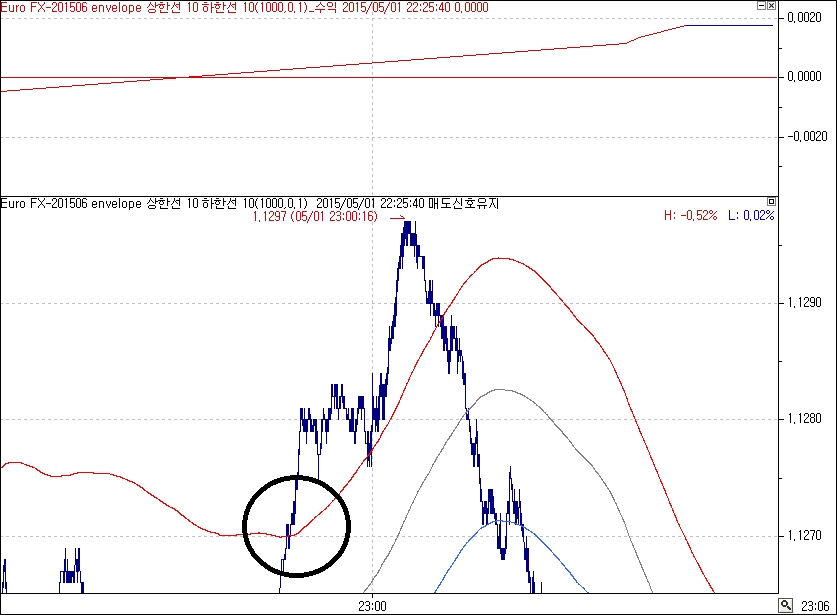
41633 질문 했었는데요..
Input : Period(1000), Percent(0.1);
var : center(0),UPline(0),DNline(0),T(0);
center = ma(C, Period);
UPline = EnvelopeUp(Period, Percent);
Dnline = EnvelopeDown(Period, Percent);
if crossup(c,upline) Then{
T =1;
var1 = C;
}
if CrossDown(c,dnline) Then{
T =1;
var1 = C;
}
if T == 1 Then
Sell("b",AtStop,var1+PriceScale*10);
if T == -1 Then
buy("s",AtStop,var1-PriceScale*10);
SetStopProfittarget(PriceScale*10,PointStop);
envelope 중심선 하고 퍼센테이지만 위와같이 바꾸고
envelope 상한선을 돌파한이후 10틱이상 오버되면 매도하고
envelope 하한선을 이탈한 이후 10틱이상 오버되면 매수하고 익절은 10틱으로 한 수식인데
수식이 틀린건가요?
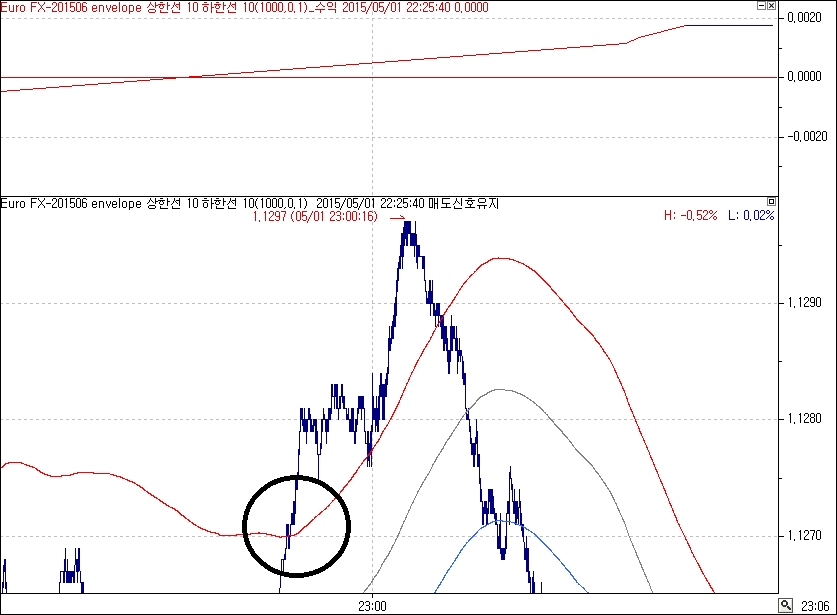
수식이 맞다면 첨부파일의 그림 동그라미 에서 매도 신호가 나와야 되는데 신호가 안나옵니다..
그림이 안보이면 위의 수식을 넣고 시뮬레이션 해보면 5월 2일 04 시 40분 근처에 상한선을 돌파하고 10틱이상 움직였는데도 매도신호가 안나오고 엉뚱한데서 신호가 나옵니다..
- 1. envelope_2.jpg (0.17 MB)
답변 1

예스스탁 예스스탁 답변
2015-05-04 14:47:42
안녕하세요
예스스탁입니다.
신호타입이 반대로 되어 있었습니다.
아래 수정한 식입니다.
Input : Period(1000), Percent(0.1);
var : center(0),UPline(0),DNline(0),T(0);
center = ma(C, Period);
UPline = EnvelopeUp(Period, Percent);
Dnline = EnvelopeDown(Period, Percent);
if crossup(c,upline) Then{
T =1;
var1 = C;
}
if CrossDown(c,dnline) Then{
T =1;
var1 = C;
}
if T == 1 Then{
Sell("b",AtLimit,var1+PriceScale*10);
}
if T == -1 Then
buy("s",AtLimit,var1-PriceScale*10);
SetStopProfittarget(PriceScale*10,PointStop);
현재 작성된 식에서 손절등이 있으면
손절후 다시 또 동일방향으로 진입하게 됩니다.
해당 부분 막고자 하시면 아래식 이용하시면 됩니다.
Input : Period(1000), Percent(0.1);
var : center(0),UPline(0),DNline(0),T(0);
center = ma(C, Period);
UPline = EnvelopeUp(Period, Percent);
Dnline = EnvelopeDown(Period, Percent);
if crossup(c,upline) Then{
T =1;
var1 = C;
}
if CrossDown(c,dnline) Then{
T =1;
var1 = C;
}
if T == 1 Then{
if H > var1+PriceScale*10 Then
Sell("b",AtLimit,var1+PriceScale*10);
}
if T == -1 Then{
if L > var1-PriceScale*10 Then
buy("s",AtLimit,var1-PriceScale*10);
}
SetStopProfittarget(PriceScale*10,PointStop);
즐거운 하루되세요
> EG_ansaltjd9979 님이 쓴 글입니다.
> 제목 : 41633 질문 했었는데요..
> 41633 질문 했었는데요..
Input : Period(1000), Percent(0.1);
var : center(0),UPline(0),DNline(0),T(0);
center = ma(C, Period);
UPline = EnvelopeUp(Period, Percent);
Dnline = EnvelopeDown(Period, Percent);
if crossup(c,upline) Then{
T =1;
var1 = C;
}
if CrossDown(c,dnline) Then{
T =1;
var1 = C;
}
if T == 1 Then
Sell("b",AtStop,var1+PriceScale*10);
if T == -1 Then
buy("s",AtStop,var1-PriceScale*10);
SetStopProfittarget(PriceScale*10,PointStop);
envelope 중심선 하고 퍼센테이지만 위와같이 바꾸고
envelope 상한선을 돌파한이후 10틱이상 오버되면 매도하고
envelope 하한선을 이탈한 이후 10틱이상 오버되면 매수하고 익절은 10틱으로 한 수식인데
수식이 틀린건가요?
수식이 맞다면 첨부파일의 그림 동그라미 에서 매도 신호가 나와야 되는데 신호가 안나옵니다..
그림이 안보이면 위의 수식을 넣고 시뮬레이션 해보면 5월 2일 04 시 40분 근처에 상한선을 돌파하고 10틱이상 움직였는데도 매도신호가 안나오고 엉뚱한데서 신호가 나옵니다..