커뮤니티
지표 수식 부탁드립니다

2025-07-31 11:03:38
845
글번호 192881
첨부 이미지
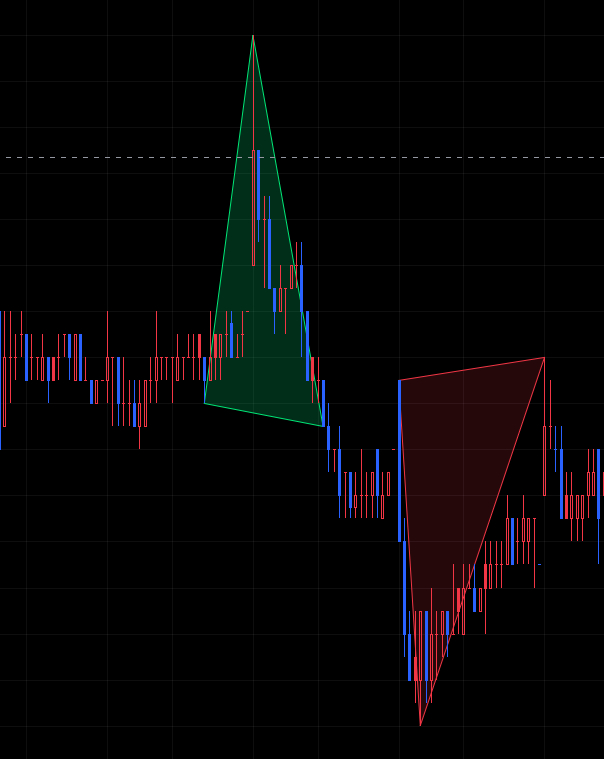
그림1

다음 TradingView 수식을 그림1과 같이 단순하게 녹색, 적색 삼각형만 표시하게끔 변환 부탁드려요. 모든 label과 수평선은 불필요합니다. 아래쪽에 GEMINI에 부탁해서 간략 버전도 있씁니다. 간략버전을 변환해 주십시오. 미리 감사드립니다.
//@version=6
indicator("Choch Pattern Levels [BigBeluga]", overlay = true, max_lines_count = 500, max_bars_back = 5000, calc_bars_count = 5000)
// INPUTS ――――――――――――――――――――{
len = input.int(10, "Length")
amount = input.int(10, "Amount of Patterns")
show_delta = input.bool(true, "Show Delta Volume", inline = "Delta")
sizeDelta = input.string("normal", "", ["tiny", "small", "normal", "large", "huge"], inline = "Delta")
col_plus = input.color(color.red, "ChoCh Up")
col_minus = input.color(color.lime, "ChoCh Dn")
var ph = float(na)
var pl = float(na)
var pl_index = int(na)
var ph_index = int(na)
var trend = false
type zone
line level
label label1
label label2
label label3
label label4
polyline poly
label label5
var ms_levels = array.new<zone>()
// }
// CALCULATIONS――――――――――{
pivotH = ta.pivothigh(len, len)
pivotL = ta.pivotlow(len, len)
if not na(pivotH)
ph_index := bar_index[len]
ph := pivotH
if not na(pivotL)
pl_index := bar_index[len]
pl := pivotL
if ta.crossover(high, ph) and not trend
check = false
l = low
lbl1 = label(na)
lbl2 = label(na)
lbl3 = label(na)
lbl4 = label(na)
lbl5 = label(na)
lne = line(na)
cp = array.new<chart.point>()
c_p1 = chart.point.from_index(ph_index, ph)
c_p2 = chart.point.from_index(bar_index, high)
cp.push(c_p1)
cp.push(c_p2)
lbl1 := label.new(c_p1, "", style = label.style_circle, color = color.new(col_plus, 30))
lbl2 := label.new(c_p2, "", style = label.style_circle, color = color.new(col_plus, 30))
delta = 0.
for i = 0 to bar_index-ph_index
l := math.min(l, low[i])
delta += close[i] > open[i] ? volume[i] : -volume[i]
for i = 0 to bar_index-ph_index
lo = low[i]
if lo == l and not check
check := true
cp.push(chart.point.from_index(bar_index-i, l))
lbl3 := label.new(bar_index-i, l, "", style = label.style_circle, color = color.new(col_plus, 30))
lne := line.new(bar_index-i, l, bar_index, l, color = col_plus)
lbl4 := label.new(bar_index, l, "◯", style = label.style_label_center, color = color.new(col_plus, 100), textcolor = col_plus)
if show_delta
lbl5 := label.new(int(math.avg(bar_index,ph_index)), math.avg(lo, high)+(high-lo)*0.1, (delta > 0 ? "+" : "") + str.tostring(delta, format.volume), style = label.style_label_center, color = color.new(col_plus, 100), textcolor = delta > 0 ? col_plus : col_minus, tooltip = "Delta Volume")
poly = polyline.new(cp, closed = true, fill_color = color.new(col_plus, 85), line_color = col_plus, line_width = 1)
z = zone.new(lne, lbl1, lbl2, lbl3, lbl4, poly, lbl5)
ms_levels.push(z)
trend := true
if ta.crossunder(low, pl) and trend
check = false
h = high
lbl1 = label(na)
lbl2 = label(na)
lbl3 = label(na)
lbl4 = label(na)
lbl5 = label(na)
lne = line(na)
cp = array.new<chart.point>()
c_p1 = chart.point.from_index(pl_index, pl)
c_p2 = chart.point.from_index(bar_index, low)
cp.push(c_p1)
cp.push(c_p2)
lbl1 := label.new(c_p1, "", style = label.style_circle, color = color.new(col_minus, 30))
lbl2 := label.new(c_p2, "", style = label.style_circle, color = color.new(col_minus, 30))
delta = 0.
for i = 0 to bar_index-pl_index
h := math.max(h, high[i])
delta += close[i] > open[i] ? volume[i] : -volume[i]
for i = 0 to bar_index-pl_index
hi = high[i]
if hi == h and not check
check := true
cp.push(chart.point.from_index(bar_index-i, h))
lbl3 := label.new(bar_index-i, h, "", style = label.style_circle, color = color.new(col_minus, 30))
lne := line.new(bar_index-i, h, bar_index, h, color = col_minus)
lbl4 := label.new(bar_index, h, "◯", style = label.style_label_center, color = color.new(col_minus, 100), textcolor = col_minus)
if show_delta
lbl5 := label.new(bar_index - i, math.avg(hi, low)-(hi-low)*0.2, (delta > 0 ? "+" : "") + str.tostring(delta, format.volume), style = label.style_label_center, color = color.new(col_minus, 100), textcolor = delta > 0 ? col_plus : col_minus)
poly = polyline.new(cp, closed = true, fill_color = color.new(col_minus, 80), line_color = col_minus, line_width = 1)
z = zone.new(lne, lbl1, lbl2, lbl3, lbl4, poly, lbl5)
ms_levels.push(z)
trend := false
body_h = close > open ? close : open
body_l = close < open ? close : open
for z in ms_levels
z.level.set_x2(bar_index+5)
z.label4.set_x(bar_index+5)
z.level.set_width(3)
z.label1.set_size(size.tiny)
z.label2.set_size(size.tiny)
z.label3.set_size(size.tiny)
z.label4.set_size(size.large)
z.label5.set_size(size.small)
if body_h > z.level.get_y1() and body_l < z.level.get_y1() or body_h[1] > z.level.get_y1() and body_l[1] < z.level.get_y1()
z.level.delete()
z.label1.delete()
z.label2.delete()
z.label3.delete()
z.label4.delete()
z.label5.delete()
z.poly.delete()
ms_levels.remove(ms_levels.indexof(z))
if ms_levels.size() > amount
z = ms_levels.shift()
z.level.delete()
z.label1.delete()
z.label2.delete()
z.label3.delete()
z.label4.delete()
z.label5.delete()
z.poly.delete()
// }
//==================================================================
// GEMINI에 부탁해서 간략화한 것입니다.
//==================================================================
//@version=6
indicator("Choch Pattern Levels[GEMINI]", overlay = true, max_lines_count = 500, max_bars_back = 5000, calc_bars_count = 5000)
// INPUTS ――――――――――――――――――――{
len = input.int(10, "Length")
amount = input.int(10, "Amount of Patterns")
col_plus = input.color(color.red, "ChoCh Up")
col_minus = input.color(color.lime, "ChoCh Dn")
var ph = float(na)
var pl = float(na)
var pl_index = int(na)
var ph_index = int(na)
var trend = false
// zone 타입에 삼각형의 기준선 정보 추가
type zone
polyline poly
float level_y
int level_bar_index
var ms_levels = array.new<zone>()
// }
// CALCULATIONS――――――――――{
pivotH = ta.pivothigh(len, len)
pivotL = ta.pivotlow(len, len)
if not na(pivotH)
ph_index := bar_index[len]
ph := pivotH
if not na(pivotL)
pl_index := bar_index[len]
pl := pivotL
if ta.crossover(high, ph) and not trend
check = false
l = low
cp = array.new<chart.point>()
c_p1 = chart.point.from_index(ph_index, ph)
c_p2 = chart.point.from_index(bar_index, high)
cp.push(c_p1)
cp.push(c_p2)
for i = 0 to bar_index-ph_index
l := math.min(l, low[i])
var found_l_index = int(na)
for i = 0 to bar_index-ph_index
lo = low[i]
if lo == l and not check
check := true
cp.push(chart.point.from_index(bar_index-i, l))
found_l_index := bar_index - i
poly = polyline.new(cp, closed = true, fill_color = color.new(col_plus, 85), line_color = col_plus, line_width = 1)
z = zone.new(poly, l, found_l_index)
ms_levels.push(z)
trend := true
// 'amount' 제한 로직
if ms_levels.size() > amount
removed_z = ms_levels.shift()
removed_z.poly.delete()
if ta.crossunder(low, pl) and trend
check = false
h = high
cp = array.new<chart.point>()
c_p1 = chart.point.from_index(pl_index, pl)
c_p2 = chart.point.from_index(bar_index, low)
cp.push(c_p1)
cp.push(c_p2)
for i = 0 to bar_index-pl_index
h := math.max(h, high[i])
var found_h_index = int(na)
for i = 0 to bar_index-pl_index
hi = high[i]
if hi == h and not check
check := true
cp.push(chart.point.from_index(bar_index-i, h))
found_h_index := bar_index - i
poly = polyline.new(cp, closed = true, fill_color = color.new(col_minus, 80), line_color = col_minus, line_width = 1)
z = zone.new(poly, h, found_h_index)
ms_levels.push(z)
trend := false
// 'amount' 제한 로직
if ms_levels.size() > amount
removed_z = ms_levels.shift()
removed_z.poly.delete()
// --- 캔들 교차 시 오래된 삼각형을 삭제하는 로직 ---
body_h = close > open ? close : open
body_l = close < open ? close : open
// **수정된 부분: 배열이 비어있지 않은지 먼저 확인**
if ms_levels.size() > 0
for i = ms_levels.size() - 1 to 0
z = ms_levels.get(i)
// level_y 또는 level_bar_index가 na 값이 아닌지 확인 (안전 장치)
if not na(z.level_y) and not na(z.level_bar_index)
if bar_index > z.level_bar_index and (
(body_h > z.level_y and body_l < z.level_y) or
(body_h[1] > z.level_y and body_l[1] < z.level_y)
)
z.poly.delete()
ms_levels.remove(i)
- 1. 193736_그림1.jpg (0.14 MB)
답변 1

예스스탁 예스스탁 답변
2025-07-31 11:10:19
안녕하세요
예스스탁입니다.
input : len(10);
input : col_plus(lime);
input : col_minus(red);
var : ph(0),phd(0),pht(0),ph_index(0);
var : pl(0),pld(0),plt(0),pl_index(0);
var : ll(0),ld(0),lt(0),hh(0),hd(0),ht(0);
var : trend(false),i(0);
Array : Tl1[100](0),tl2[100](0),tl3[100](0),zz[100](0);
if SwingHigh(1,high,len,len,len*2+1) != -1 Then
{
ph_index = index[len];
ph = high[len];
phd = sDate[len];
pht = sTime[len];
}
if Swinglow(1,low,len,len,len*2+1) != -1 Then
{
pl_index = index[len];
pl = low[len];
pld = sDate[len];
plt = sTime[len];
}
if CrossUp(high, ph) and trend == False Then
{
ll = low;
ld = sdate;
lt = sTime;
for i = 0 to index-ph_index
{
if low[i] < ll Then
{
ll = low[i];
ld = sDate[i];
lt = sTime[i];
}
}
For i = 99 DownTo 1
{
zz[i] = zz[i-1];
TL1[i] = TL1[i-1];
TL2[i] = TL2[i-1];
TL3[i] = TL3[i-1];
}
zz[0] = ll;
TL1[0] = TL_New(phd,pht,ph,sDate,sTime,h);
TL2[0] = TL_New(phd,pht,ph,ld,lt,ll);
TL3[0] = TL_New(ld,lt,ll,sDate,sTime,h);
TL_SetColor(TL1[0],col_plus);
TL_SetColor(TL2[0],col_plus);
TL_SetColor(TL3[0],col_plus);
TL_SetSize(TL1[0],2);
TL_SetSize(TL2[0],2);
TL_SetSize(TL3[0],2);
trend = true;
}
if CrossDown(low, pl) and trend == true Then
{
hh = high;
hd = sdate;
ht = sTime;
for i = 0 to index-pl_index
{
if high[i] > hh Then
{
hh = high[i];
hd = sDate[i];
ht = sTime[i];
}
}
For i = 99 DownTo 1
{
zz[i] = zz[i-1];
TL1[i] = TL1[i-1];
TL2[i] = TL2[i-1];
TL3[i] = TL3[i-1];
}
zz[0] = hh;
TL1[0] = TL_New(pld,plt,pl,sDate,sTime,l);
TL2[0] = TL_New(pld,plt,pl,hd,ht,hh);
TL3[0] = TL_New(hd,ht,hh,sDate,sTime,l);
TL_SetColor(TL1[0],col_minus);
TL_SetColor(TL2[0],col_minus);
TL_SetColor(TL3[0],col_minus);
TL_SetSize(TL1[0],2);
TL_SetSize(TL2[0],2);
TL_SetSize(TL3[0],2);
trend = false;
}
var : body_h(0),body_l(0);
body_h = max(close , open);
body_l = min(close , open);
For i = 0 to 99
{
if zz[i] > 0 and (body_h > zz[i] and body_l < zz[i] or body_h[1] > zz[i] and body_l[1] < zz[i])Then
{
zz[i] = 0;
TL_Delete(TL1[i]);
TL_Delete(TL2[i]);
TL_Delete(TL3[i]);
}
}
즐거운 하루되세요
> 고도산 님이 쓴 글입니다.
> 제목 : 지표 수식 부탁드립니다
> 다음 TradingView 수식을 그림1과 같이 단순하게 녹색, 적색 삼각형만 표시하게끔 변환 부탁드려요. 모든 label과 수평선은 불필요합니다. 아래쪽에 GEMINI에 부탁해서 간략 버전도 있씁니다. 간략버전을 변환해 주십시오. 미리 감사드립니다.
//@version=6
indicator("Choch Pattern Levels [BigBeluga]", overlay = true, max_lines_count = 500, max_bars_back = 5000, calc_bars_count = 5000)
// INPUTS ――――――――――――――――――――{
len = input.int(10, "Length")
amount = input.int(10, "Amount of Patterns")
show_delta = input.bool(true, "Show Delta Volume", inline = "Delta")
sizeDelta = input.string("normal", "", ["tiny", "small", "normal", "large", "huge"], inline = "Delta")
col_plus = input.color(color.red, "ChoCh Up")
col_minus = input.color(color.lime, "ChoCh Dn")
var ph = float(na)
var pl = float(na)
var pl_index = int(na)
var ph_index = int(na)
var trend = false
type zone
line level
label label1
label label2
label label3
label label4
polyline poly
label label5
var ms_levels = array.new<zone>()
// }
// CALCULATIONS――――――――――{
pivotH = ta.pivothigh(len, len)
pivotL = ta.pivotlow(len, len)
if not na(pivotH)
ph_index := bar_index[len]
ph := pivotH
if not na(pivotL)
pl_index := bar_index[len]
pl := pivotL
if ta.crossover(high, ph) and not trend
check = false
l = low
lbl1 = label(na)
lbl2 = label(na)
lbl3 = label(na)
lbl4 = label(na)
lbl5 = label(na)
lne = line(na)
cp = array.new<chart.point>()
c_p1 = chart.point.from_index(ph_index, ph)
c_p2 = chart.point.from_index(bar_index, high)
cp.push(c_p1)
cp.push(c_p2)
lbl1 := label.new(c_p1, "", style = label.style_circle, color = color.new(col_plus, 30))
lbl2 := label.new(c_p2, "", style = label.style_circle, color = color.new(col_plus, 30))
delta = 0.
for i = 0 to bar_index-ph_index
l := math.min(l, low[i])
delta += close[i] > open[i] ? volume[i] : -volume[i]
for i = 0 to bar_index-ph_index
lo = low[i]
if lo == l and not check
check := true
cp.push(chart.point.from_index(bar_index-i, l))
lbl3 := label.new(bar_index-i, l, "", style = label.style_circle, color = color.new(col_plus, 30))
lne := line.new(bar_index-i, l, bar_index, l, color = col_plus)
lbl4 := label.new(bar_index, l, "◯", style = label.style_label_center, color = color.new(col_plus, 100), textcolor = col_plus)
if show_delta
lbl5 := label.new(int(math.avg(bar_index,ph_index)), math.avg(lo, high)+(high-lo)*0.1, (delta > 0 ? "+" : "") + str.tostring(delta, format.volume), style = label.style_label_center, color = color.new(col_plus, 100), textcolor = delta > 0 ? col_plus : col_minus, tooltip = "Delta Volume")
poly = polyline.new(cp, closed = true, fill_color = color.new(col_plus, 85), line_color = col_plus, line_width = 1)
z = zone.new(lne, lbl1, lbl2, lbl3, lbl4, poly, lbl5)
ms_levels.push(z)
trend := true
if ta.crossunder(low, pl) and trend
check = false
h = high
lbl1 = label(na)
lbl2 = label(na)
lbl3 = label(na)
lbl4 = label(na)
lbl5 = label(na)
lne = line(na)
cp = array.new<chart.point>()
c_p1 = chart.point.from_index(pl_index, pl)
c_p2 = chart.point.from_index(bar_index, low)
cp.push(c_p1)
cp.push(c_p2)
lbl1 := label.new(c_p1, "", style = label.style_circle, color = color.new(col_minus, 30))
lbl2 := label.new(c_p2, "", style = label.style_circle, color = color.new(col_minus, 30))
delta = 0.
for i = 0 to bar_index-pl_index
h := math.max(h, high[i])
delta += close[i] > open[i] ? volume[i] : -volume[i]
for i = 0 to bar_index-pl_index
hi = high[i]
if hi == h and not check
check := true
cp.push(chart.point.from_index(bar_index-i, h))
lbl3 := label.new(bar_index-i, h, "", style = label.style_circle, color = color.new(col_minus, 30))
lne := line.new(bar_index-i, h, bar_index, h, color = col_minus)
lbl4 := label.new(bar_index, h, "◯", style = label.style_label_center, color = color.new(col_minus, 100), textcolor = col_minus)
if show_delta
lbl5 := label.new(bar_index - i, math.avg(hi, low)-(hi-low)*0.2, (delta > 0 ? "+" : "") + str.tostring(delta, format.volume), style = label.style_label_center, color = color.new(col_minus, 100), textcolor = delta > 0 ? col_plus : col_minus)
poly = polyline.new(cp, closed = true, fill_color = color.new(col_minus, 80), line_color = col_minus, line_width = 1)
z = zone.new(lne, lbl1, lbl2, lbl3, lbl4, poly, lbl5)
ms_levels.push(z)
trend := false
body_h = close > open ? close : open
body_l = close < open ? close : open
for z in ms_levels
z.level.set_x2(bar_index+5)
z.label4.set_x(bar_index+5)
z.level.set_width(3)
z.label1.set_size(size.tiny)
z.label2.set_size(size.tiny)
z.label3.set_size(size.tiny)
z.label4.set_size(size.large)
z.label5.set_size(size.small)
if body_h > z.level.get_y1() and body_l < z.level.get_y1() or body_h[1] > z.level.get_y1() and body_l[1] < z.level.get_y1()
z.level.delete()
z.label1.delete()
z.label2.delete()
z.label3.delete()
z.label4.delete()
z.label5.delete()
z.poly.delete()
ms_levels.remove(ms_levels.indexof(z))
if ms_levels.size() > amount
z = ms_levels.shift()
z.level.delete()
z.label1.delete()
z.label2.delete()
z.label3.delete()
z.label4.delete()
z.label5.delete()
z.poly.delete()
// }
//==================================================================
// GEMINI에 부탁해서 간략화한 것입니다.
//==================================================================
//@version=6
indicator("Choch Pattern Levels[GEMINI]", overlay = true, max_lines_count = 500, max_bars_back = 5000, calc_bars_count = 5000)
// INPUTS ――――――――――――――――――――{
len = input.int(10, "Length")
amount = input.int(10, "Amount of Patterns")
col_plus = input.color(color.red, "ChoCh Up")
col_minus = input.color(color.lime, "ChoCh Dn")
var ph = float(na)
var pl = float(na)
var pl_index = int(na)
var ph_index = int(na)
var trend = false
// zone 타입에 삼각형의 기준선 정보 추가
type zone
polyline poly
float level_y
int level_bar_index
var ms_levels = array.new<zone>()
// }
// CALCULATIONS――――――――――{
pivotH = ta.pivothigh(len, len)
pivotL = ta.pivotlow(len, len)
if not na(pivotH)
ph_index := bar_index[len]
ph := pivotH
if not na(pivotL)
pl_index := bar_index[len]
pl := pivotL
if ta.crossover(high, ph) and not trend
check = false
l = low
cp = array.new<chart.point>()
c_p1 = chart.point.from_index(ph_index, ph)
c_p2 = chart.point.from_index(bar_index, high)
cp.push(c_p1)
cp.push(c_p2)
for i = 0 to bar_index-ph_index
l := math.min(l, low[i])
var found_l_index = int(na)
for i = 0 to bar_index-ph_index
lo = low[i]
if lo == l and not check
check := true
cp.push(chart.point.from_index(bar_index-i, l))
found_l_index := bar_index - i
poly = polyline.new(cp, closed = true, fill_color = color.new(col_plus, 85), line_color = col_plus, line_width = 1)
z = zone.new(poly, l, found_l_index)
ms_levels.push(z)
trend := true
// 'amount' 제한 로직
if ms_levels.size() > amount
removed_z = ms_levels.shift()
removed_z.poly.delete()
if ta.crossunder(low, pl) and trend
check = false
h = high
cp = array.new<chart.point>()
c_p1 = chart.point.from_index(pl_index, pl)
c_p2 = chart.point.from_index(bar_index, low)
cp.push(c_p1)
cp.push(c_p2)
for i = 0 to bar_index-pl_index
h := math.max(h, high[i])
var found_h_index = int(na)
for i = 0 to bar_index-pl_index
hi = high[i]
if hi == h and not check
check := true
cp.push(chart.point.from_index(bar_index-i, h))
found_h_index := bar_index - i
poly = polyline.new(cp, closed = true, fill_color = color.new(col_minus, 80), line_color = col_minus, line_width = 1)
z = zone.new(poly, h, found_h_index)
ms_levels.push(z)
trend := false
// 'amount' 제한 로직
if ms_levels.size() > amount
removed_z = ms_levels.shift()
removed_z.poly.delete()
// --- 캔들 교차 시 오래된 삼각형을 삭제하는 로직 ---
body_h = close > open ? close : open
body_l = close < open ? close : open
// **수정된 부분: 배열이 비어있지 않은지 먼저 확인**
if ms_levels.size() > 0
for i = ms_levels.size() - 1 to 0
z = ms_levels.get(i)
// level_y 또는 level_bar_index가 na 값이 아닌지 확인 (안전 장치)
if not na(z.level_y) and not na(z.level_bar_index)
if bar_index > z.level_bar_index and (
(body_h > z.level_y and body_l < z.level_y) or
(body_h[1] > z.level_y and body_l[1] < z.level_y)
)
z.poly.delete()
ms_levels.remove(i)
다음글
이전글