커뮤니티
지표 수정바랍니다.

2025-07-27 18:50:14
1826
글번호 192772
첨부 이미지
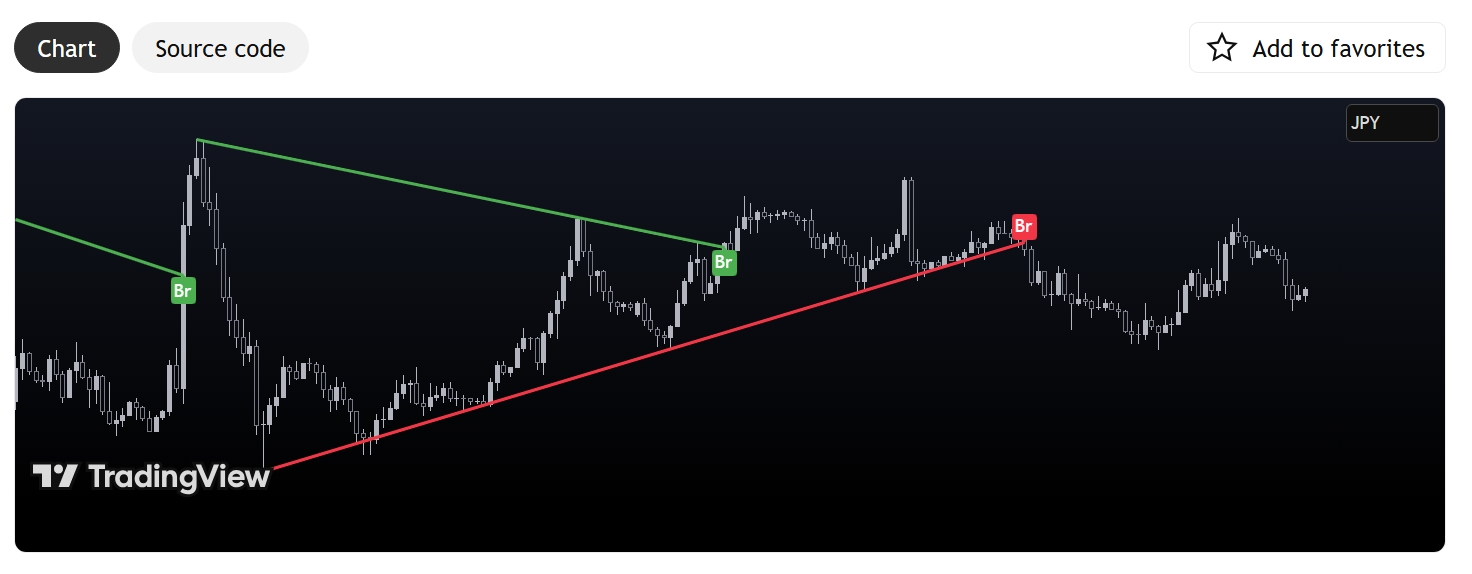
그림1

안녕하세요?
아래 트뷰 원본지표를 예스랭귀지로 변환하였는데, 선은 잘 나오는 것 같은데, 원본 그림처럼 잘 나오지 않는 것 같습니다. 그리고 당일만 선들이 나오네요. 과거에도 선들이 나오면 좋겠습니다. 체크한번 부탁드립니다.
== 예스랭귀지 ==
// === 1. Input Parameters ===
Input:
PivotLen(20), // Pivot length for detection
Repainting(True), // If False, wait for bar close (LastBarOnChart=1) to confirm breakout
ShowTargets(False), // Draw flat target lines at pivot prices
BearColor(Red), // Color for bearish trendlines
BullColor(Green), // Color for bullish trendlines
ExtendLeft(True), // Always extend trendlines to the left
ExtendRight(True); // Always extend trendlines to the right
// === 2. Internal Variables ===
Vars:
phBar(0), plBar(0), // Offsets for swing pivots
lastPhIndex(0), prevPhIndex(0),
lastPhVal(0), prevPhVal(0),
lastPlIndex(0), prevPlIndex(0),
lastPlVal(0), prevPlVal(0),
offsetB(0), offsetE(0), // Relative bar offsets for trendline endpoints
phLineID(0), plLineID(0), // Trendline object IDs
hasCrossPh(False), hasCrossPl(False); // Breakout flags
// === 3. Detect Swing Pivots ===
phBar = SwingHighBar(1, H, PivotLen, PivotLen, PivotLen*2+1);
plBar = SwingLowBar(1, L, PivotLen, PivotLen, PivotLen*2+1);
// === 4. On New High Pivot ===
if phBar == PivotLen then
{
prevPhIndex = lastPhIndex;
prevPhVal = lastPhVal;
lastPhIndex = BarIndex - phBar;
lastPhVal = H[phBar];
hasCrossPh = False;
if phLineID <> 0 then TL_Delete(phLineID);
if prevPhIndex > 0 then
{
offsetB = BarIndex - prevPhIndex;
offsetE = phBar;
phLineID = TL_New(
sDate[offsetB], sTime[offsetB], prevPhVal,
sDate[offsetE], sTime[offsetE], lastPhVal
);
// Style and extend the line both directions
TL_SetColor(phLineID, BullColor);
TL_SetSize(phLineID, 2);
TL_SetStyle(phLineID, 2); // dashed style
TL_SetExtLeft(phLineID, ExtendLeft);
TL_SetExtRight(phLineID, ExtendRight);
}
}
// === 5. On New Low Pivot ===
if plBar == PivotLen then
{
prevPlIndex = lastPlIndex;
prevPlVal = lastPlVal;
lastPlIndex = BarIndex - plBar;
lastPlVal = L[plBar];
hasCrossPl = False;
if plLineID <> 0 then TL_Delete(plLineID);
if prevPlIndex > 0 then
{
offsetB = BarIndex - prevPlIndex;
offsetE = plBar;
plLineID = TL_New(
sDate[offsetB], sTime[offsetB], prevPlVal,
sDate[offsetE], sTime[offsetE], lastPlVal
);
TL_SetColor(plLineID, BearColor);
TL_SetSize(plLineID, 2);
TL_SetStyle(plLineID, 2);
TL_SetExtLeft(plLineID, ExtendLeft);
TL_SetExtRight(plLineID, ExtendRight);
}
}
// === 6. Breakout Detection ===
if phLineID <> 0 and !hasCrossPh then
{
if Repainting or LastBarOnChart == 1 then
{
if C > lastPhVal then
{
hasCrossPh = True;
TL_SetEnd(phLineID, sDate, sTime, lastPhVal);
Text_New(sDate, sTime, lastPhVal, "Br");
}
}
}
if plLineID <> 0 and !hasCrossPl then
{
if Repainting or LastBarOnChart == 1 then
{
if C < lastPlVal then
{
hasCrossPl = True;
TL_SetEnd(plLineID, sDate, sTime, lastPlVal);
Text_New(sDate, sTime, lastPlVal, "Br");
}
}
}
// === 7. Optional Target Lines ===
if ShowTargets then
{
if phLineID <> 0 then TL_New(sDate, sTime, lastPhVal, NextBarSdate, NextBarStime, lastPhVal);
if plLineID <> 0 then TL_New(sDate, sTime, lastPlVal, NextBarSdate, NextBarStime, lastPlVal);
}
== 트뷰 원본 스크립트 ==
// This source code is subject to the terms of the Mozilla Public License 2.0 at https://mozilla.org/MPL/2.0/
// © HoanGhetti
//@version=5
indicator("지표", overlay = true, max_lines_count = 500)
import HoanGhetti/SimpleTrendlines/4 as tl
input_len = input.int(defval = 20, title = 'Pivot Length', minval = 1)
input_pivotType = input.string(defval = 'Normal', title = 'Pivot Type', options = ['Normal', 'Fast'], tooltip = 'Normal: Uses Pine₩'s built-in pivot system.₩n₩nFast: Uses a custom pivot system that tracks every reversal.')
input_repaint = input.bool(defval = true, title = 'Repainting', tooltip = 'If disabled, it will wait for bar confirmation to avoid printing false alerts.')
input_targets = input.bool(defval = false, title = 'Target Levels')
input_bearC = input.color(defval = color.red, title = 'Bear Breakout', group = 'Styling')
input_bullC = input.color(defval = color.green, title = 'Bull Breakout', group = 'Styling')
input_extend = input.string(defval = extend.none, title = 'Extend', options = [extend.none, extend.right, extend.left, extend.both], group = 'Styling')
input_style = input.string(defval = line.style_dotted, title = 'Trendline Style', options = [line.style_dotted, line.style_dashed, line.style_solid], group = 'Styling')
input_tstyle = input.string(defval = line.style_dashed, title = 'Target Style', options = [line.style_dotted, line.style_dashed, line.style_solid], group = 'Styling')
input_override = input.bool(defval = false, title = 'Override Source', group = 'Override', tooltip = 'Overriding the source will allow this to create trendlines on any specified source.')
input_useSrc = input.bool(defval = true, title = 'Use Source for Cross Detection', group = 'Override', tooltip = 'Instead of checking if the close value crossed trendline, check for the specified source.')
input_source = input.source(defval = low, title = 'Source', group = 'Override')
pl = fixnan(ta.pivotlow(input_override ? input_source : low, input_pivotType == 'Normal' ? input_len : 1, input_len))
ph = fixnan(ta.pivothigh(input_override ? input_source : high, input_pivotType == 'Normal' ? input_len : 1, input_len))
pivot(float pType) =>
pivot = pType == pl ? pl : ph
xAxis = ta.valuewhen(ta.change(pivot), bar_index, 0) - ta.valuewhen(ta.change(pivot), bar_index, 1)
prevPivot = ta.valuewhen(ta.change(pivot), pivot, 1)
pivotCond = ta.change(pivot) and (pType == pl ? pivot > prevPivot : pivot < prevPivot)
pData = tl.new(x_axis = xAxis, offset = input_len, strictMode = true, strictType = pType == pl ? 0 : 1)
pData.drawLine(pivotCond, prevPivot, pivot, input_override ? input_source : na)
pData
breakout(tl.Trendline this, float pType) =>
var bool hasCrossed = false
if ta.change(this.lines.startline.get_y1())
hasCrossed := false
this.drawTrendline(not hasCrossed)
confirmation = not hasCrossed and (input_repaint ? not hasCrossed : barstate.isconfirmed)
if (pType == pl ? (input_override and input_useSrc ? input_source : close) < this.lines.trendline.get_y2() : (input_override and input_useSrc ? input_source : close) > this.lines.trendline.get_y2()) and confirmation
hasCrossed := true
this.lines.startline.set_xy2(this.lines.trendline.get_x2(), this.lines.trendline.get_y2())
this.lines.trendline.set_xy2(na, na)
this.lines.startline.copy()
hasCrossed
plData = pivot(pl)
phData = pivot(ph)
style(tl.Trendline this, color col) =>
this.lines.startline.set_color(col), this.lines.trendline.set_color(col)
this.lines.startline.set_width(2), this.lines.trendline.set_width(2)
this.lines.trendline.set_style(input_style), this.lines.trendline.set_extend(input_extend)
style(plData, input_bearC), style(phData, input_bullC)
cu = breakout(plData, pl)
co = breakout(phData, ph)
plotshape(ta.change(cu) and cu ? plData.lines.startline.get_y2() : na, title = 'Bearish Breakout', style = shape.labeldown, color = input_bearC, textcolor = color.white, location = location.absolute, text = 'Br')
plotshape(ta.change(co) and co ? phData.lines.startline.get_y2() : na, title = 'Bullish Breakout', style = shape.labelup, color = input_bullC, textcolor = color.white, location = location.absolute, text = 'Br')
alertcondition(ta.change(cu) and cu, 'Bearish Breakout')
alertcondition(ta.change(co) and co, 'Bullish Breakout')
// Target Levels
phData_target = tl.new(phData.values.changeInX)
plData_target = tl.new(plData.values.changeInX)
phData_target.drawLine(ta.change(phData.values.y1) and input_targets, phData.values.y2, phData.values.y2)
plData_target.drawLine(ta.change(plData.values.y1) and input_targets, plData.values.y2, plData.values.y2)
target_style(tl.Trendline this, color col) =>
this.lines.startline.set_style(input_tstyle)
this.lines.trendline.set_style(input_tstyle)
this.lines.startline.set_color(col)
this.lines.trendline.set_color(col)
target_style(plData_target, input_bearC)
target_style(phData_target, input_bullC)
breakout(phData_target, ph)
breakout(plData_target, pl)
- 1. 원본.jpeg (0.19 MB)
답변 1

예스스탁 예스스탁 답변
2025-07-28 13:23:47
안녕하세요
예스스탁입니다.
올리신 내용은 처리해 드리기 어렵습니다.
내용 파악하고 변환하는데 시간이 많이 소모됩니다.
업무상 일정시간 이상 요구되는 내용이 답변이 가능하지 않습니다.
도움을 드리지 못해 죄송합니다.
즐거운 하루되세요
> 주식남 님이 쓴 글입니다.
> 제목 : 지표 수정바랍니다.
> 안녕하세요?
아래 트뷰 원본지표를 예스랭귀지로 변환하였는데, 선은 잘 나오는 것 같은데, 원본 그림처럼 잘 나오지 않는 것 같습니다. 그리고 당일만 선들이 나오네요. 과거에도 선들이 나오면 좋겠습니다. 체크한번 부탁드립니다.
== 예스랭귀지 ==
// === 1. Input Parameters ===
Input:
PivotLen(20), // Pivot length for detection
Repainting(True), // If False, wait for bar close (LastBarOnChart=1) to confirm breakout
ShowTargets(False), // Draw flat target lines at pivot prices
BearColor(Red), // Color for bearish trendlines
BullColor(Green), // Color for bullish trendlines
ExtendLeft(True), // Always extend trendlines to the left
ExtendRight(True); // Always extend trendlines to the right
// === 2. Internal Variables ===
Vars:
phBar(0), plBar(0), // Offsets for swing pivots
lastPhIndex(0), prevPhIndex(0),
lastPhVal(0), prevPhVal(0),
lastPlIndex(0), prevPlIndex(0),
lastPlVal(0), prevPlVal(0),
offsetB(0), offsetE(0), // Relative bar offsets for trendline endpoints
phLineID(0), plLineID(0), // Trendline object IDs
hasCrossPh(False), hasCrossPl(False); // Breakout flags
// === 3. Detect Swing Pivots ===
phBar = SwingHighBar(1, H, PivotLen, PivotLen, PivotLen*2+1);
plBar = SwingLowBar(1, L, PivotLen, PivotLen, PivotLen*2+1);
// === 4. On New High Pivot ===
if phBar == PivotLen then
{
prevPhIndex = lastPhIndex;
prevPhVal = lastPhVal;
lastPhIndex = BarIndex - phBar;
lastPhVal = H[phBar];
hasCrossPh = False;
if phLineID <> 0 then TL_Delete(phLineID);
if prevPhIndex > 0 then
{
offsetB = BarIndex - prevPhIndex;
offsetE = phBar;
phLineID = TL_New(
sDate[offsetB], sTime[offsetB], prevPhVal,
sDate[offsetE], sTime[offsetE], lastPhVal
);
// Style and extend the line both directions
TL_SetColor(phLineID, BullColor);
TL_SetSize(phLineID, 2);
TL_SetStyle(phLineID, 2); // dashed style
TL_SetExtLeft(phLineID, ExtendLeft);
TL_SetExtRight(phLineID, ExtendRight);
}
}
// === 5. On New Low Pivot ===
if plBar == PivotLen then
{
prevPlIndex = lastPlIndex;
prevPlVal = lastPlVal;
lastPlIndex = BarIndex - plBar;
lastPlVal = L[plBar];
hasCrossPl = False;
if plLineID <> 0 then TL_Delete(plLineID);
if prevPlIndex > 0 then
{
offsetB = BarIndex - prevPlIndex;
offsetE = plBar;
plLineID = TL_New(
sDate[offsetB], sTime[offsetB], prevPlVal,
sDate[offsetE], sTime[offsetE], lastPlVal
);
TL_SetColor(plLineID, BearColor);
TL_SetSize(plLineID, 2);
TL_SetStyle(plLineID, 2);
TL_SetExtLeft(plLineID, ExtendLeft);
TL_SetExtRight(plLineID, ExtendRight);
}
}
// === 6. Breakout Detection ===
if phLineID <> 0 and !hasCrossPh then
{
if Repainting or LastBarOnChart == 1 then
{
if C > lastPhVal then
{
hasCrossPh = True;
TL_SetEnd(phLineID, sDate, sTime, lastPhVal);
Text_New(sDate, sTime, lastPhVal, "Br");
}
}
}
if plLineID <> 0 and !hasCrossPl then
{
if Repainting or LastBarOnChart == 1 then
{
if C < lastPlVal then
{
hasCrossPl = True;
TL_SetEnd(plLineID, sDate, sTime, lastPlVal);
Text_New(sDate, sTime, lastPlVal, "Br");
}
}
}
// === 7. Optional Target Lines ===
if ShowTargets then
{
if phLineID <> 0 then TL_New(sDate, sTime, lastPhVal, NextBarSdate, NextBarStime, lastPhVal);
if plLineID <> 0 then TL_New(sDate, sTime, lastPlVal, NextBarSdate, NextBarStime, lastPlVal);
}
== 트뷰 원본 스크립트 ==
// This source code is subject to the terms of the Mozilla Public License 2.0 at https://mozilla.org/MPL/2.0/
// © HoanGhetti
//@version=5
indicator("지표", overlay = true, max_lines_count = 500)
import HoanGhetti/SimpleTrendlines/4 as tl
input_len = input.int(defval = 20, title = 'Pivot Length', minval = 1)
input_pivotType = input.string(defval = 'Normal', title = 'Pivot Type', options = ['Normal', 'Fast'], tooltip = 'Normal: Uses Pine₩'s built-in pivot system.₩n₩nFast: Uses a custom pivot system that tracks every reversal.')
input_repaint = input.bool(defval = true, title = 'Repainting', tooltip = 'If disabled, it will wait for bar confirmation to avoid printing false alerts.')
input_targets = input.bool(defval = false, title = 'Target Levels')
input_bearC = input.color(defval = color.red, title = 'Bear Breakout', group = 'Styling')
input_bullC = input.color(defval = color.green, title = 'Bull Breakout', group = 'Styling')
input_extend = input.string(defval = extend.none, title = 'Extend', options = [extend.none, extend.right, extend.left, extend.both], group = 'Styling')
input_style = input.string(defval = line.style_dotted, title = 'Trendline Style', options = [line.style_dotted, line.style_dashed, line.style_solid], group = 'Styling')
input_tstyle = input.string(defval = line.style_dashed, title = 'Target Style', options = [line.style_dotted, line.style_dashed, line.style_solid], group = 'Styling')
input_override = input.bool(defval = false, title = 'Override Source', group = 'Override', tooltip = 'Overriding the source will allow this to create trendlines on any specified source.')
input_useSrc = input.bool(defval = true, title = 'Use Source for Cross Detection', group = 'Override', tooltip = 'Instead of checking if the close value crossed trendline, check for the specified source.')
input_source = input.source(defval = low, title = 'Source', group = 'Override')
pl = fixnan(ta.pivotlow(input_override ? input_source : low, input_pivotType == 'Normal' ? input_len : 1, input_len))
ph = fixnan(ta.pivothigh(input_override ? input_source : high, input_pivotType == 'Normal' ? input_len : 1, input_len))
pivot(float pType) =>
pivot = pType == pl ? pl : ph
xAxis = ta.valuewhen(ta.change(pivot), bar_index, 0) - ta.valuewhen(ta.change(pivot), bar_index, 1)
prevPivot = ta.valuewhen(ta.change(pivot), pivot, 1)
pivotCond = ta.change(pivot) and (pType == pl ? pivot > prevPivot : pivot < prevPivot)
pData = tl.new(x_axis = xAxis, offset = input_len, strictMode = true, strictType = pType == pl ? 0 : 1)
pData.drawLine(pivotCond, prevPivot, pivot, input_override ? input_source : na)
pData
breakout(tl.Trendline this, float pType) =>
var bool hasCrossed = false
if ta.change(this.lines.startline.get_y1())
hasCrossed := false
this.drawTrendline(not hasCrossed)
confirmation = not hasCrossed and (input_repaint ? not hasCrossed : barstate.isconfirmed)
if (pType == pl ? (input_override and input_useSrc ? input_source : close) < this.lines.trendline.get_y2() : (input_override and input_useSrc ? input_source : close) > this.lines.trendline.get_y2()) and confirmation
hasCrossed := true
this.lines.startline.set_xy2(this.lines.trendline.get_x2(), this.lines.trendline.get_y2())
this.lines.trendline.set_xy2(na, na)
this.lines.startline.copy()
hasCrossed
plData = pivot(pl)
phData = pivot(ph)
style(tl.Trendline this, color col) =>
this.lines.startline.set_color(col), this.lines.trendline.set_color(col)
this.lines.startline.set_width(2), this.lines.trendline.set_width(2)
this.lines.trendline.set_style(input_style), this.lines.trendline.set_extend(input_extend)
style(plData, input_bearC), style(phData, input_bullC)
cu = breakout(plData, pl)
co = breakout(phData, ph)
plotshape(ta.change(cu) and cu ? plData.lines.startline.get_y2() : na, title = 'Bearish Breakout', style = shape.labeldown, color = input_bearC, textcolor = color.white, location = location.absolute, text = 'Br')
plotshape(ta.change(co) and co ? phData.lines.startline.get_y2() : na, title = 'Bullish Breakout', style = shape.labelup, color = input_bullC, textcolor = color.white, location = location.absolute, text = 'Br')
alertcondition(ta.change(cu) and cu, 'Bearish Breakout')
alertcondition(ta.change(co) and co, 'Bullish Breakout')
// Target Levels
phData_target = tl.new(phData.values.changeInX)
plData_target = tl.new(plData.values.changeInX)
phData_target.drawLine(ta.change(phData.values.y1) and input_targets, phData.values.y2, phData.values.y2)
plData_target.drawLine(ta.change(plData.values.y1) and input_targets, plData.values.y2, plData.values.y2)
target_style(tl.Trendline this, color col) =>
this.lines.startline.set_style(input_tstyle)
this.lines.trendline.set_style(input_tstyle)
this.lines.startline.set_color(col)
this.lines.trendline.set_color(col)
target_style(plData_target, input_bearC)
target_style(phData_target, input_bullC)
breakout(phData_target, ph)
breakout(plData_target, pl)
다음글
이전글