커뮤니티
문의드립니다.

2025-07-14 11:43:23
413
글번호 192482
첨부 이미지
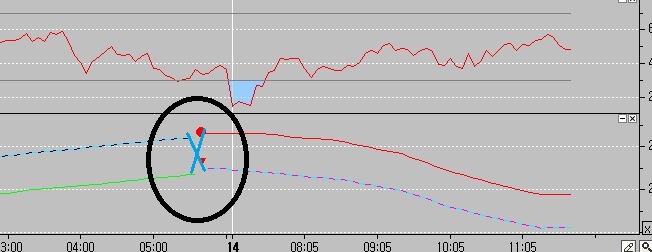
그림1

이전에 다른 분이 문의한 내용에 대한 답을 아래와 같이 주셧습니다.
제게도 유용하다 싶어서 사용하보려 합니다.
그런데 차트에 적용해보니 첨부된 그림처럼 나오는데 동그라미 표시된 부분을 연결하려면 수식을 어떻게 수정해야 하는지요?
================
input : length(50);
input : factor(1.0);
input : col_up(lime);
input : col_dn(Red);
input : col_ul(Cyan);
var : direction(0),count_up(0),count_dn(0);
var : volatility(0),upper(0),lower(0),sig_up(False),sig_dn(False);
var : upper_band(0),lower_band(0);
var : hlc3(0),alpha(0),ATrv(0);
var :tx1(0),tx2(0);
var1 = ma(C,25);
var2 = ma(C,length);
hlc3 = (H+L+C)/3;
volatility = ma(high-low, 70) * factor;
upper = highest(var1 + volatility, int(length/2));
lower = lowest(var2 - volatility, int(length/2));
sig_up = CrossUp(hlc3, upper);
sig_dn = CrossDown(hlc3, lower);
if sig_up == true Then
direction = 1;
if sig_dn == true Then
direction = -1;
upper = iff(direction == 1 , Nan , upper);
lower = iff(direction == -1 , Nan , lower);
if direction == 1 Then
{
count_up = count_up+ 0.5;
count_dn = 0;
}
if direction == -1 Then
{
count_dn = count_dn+0.5;
count_up = 0;
}
count_up = iff(count_up > 70 , 70 , count_up);
count_dn = iff(count_dn > 70 , 70 , count_dn);
alpha = 1 / 100 ;
ATrV = IFf(IsNan(ATrV[1]) == true, ma(TrueRange,100) , alpha * TrueRange + (1 - alpha) * IFf(isnan(ATrV[1])==true,0,ATrV[1]));
upper_band = lower + ATRV*5;
lower_band = upper - ATRV*5;
if IsNaN(upper_band) == False Then
plot1(upper_band, "Upper Wave",iff(index % 2 == 0 , nan , col_ul));
Else
NoPlot(1);
if IsNaN(lower_band) == False Then
plot2(lower_band, "Lower Wave",iff(index % 2 == 0 , nan , col_ul));
Else
NoPlot(2);
if IsNaN(upper) == False Then
plot3(upper, "Upper Band",col_dn);
Else
NoPlot(3);
if IsNaN(lower) == False Then
plot4(lower, "Lower Band",col_up);
Else
NoPlot(4);
if direction != direction[1] and direction == 1 Then
{
tx1 = Text_New_Self(sDate,sTime,Lower,"●");
Text_SetStyle(tx1,2,2);
Text_SetColor(tx1,col_up);
tx2 = Text_New_Self(sDate,sTime,L,"▲");
Text_SetStyle(tx2,2,0);
Text_SetColor(tx2,col_up);
}
if direction != direction[1] and direction == -1 Then
{
tx1 = Text_New_Self(sDate,sTime,upper,"●");
Text_SetStyle(tx1,2,2);
Text_SetColor(tx1,col_dn);
tx2 = Text_New_Self(sDate,sTime,H,"▼");
Text_SetStyle(tx2,2,1);
Text_SetColor(tx2,col_dn);
}
=========================
항상 감사드립니다. 수고하세요!!!
- 1. 193336_3.jpg (0.04 MB)
답변 1

예스스탁 예스스탁 답변
2025-07-14 13:00:00
안녕하세요
예스스탁입니다.
현재 조건에 따라 각각의 plot으로 출력되는데
한개의 plot으로 조건에 따라 값을 달리해 출력되게 하시면 됩니다.
input : length(50);
input : factor(1.0);
input : col_up(lime);
input : col_dn(Red);
input : col_ul(Cyan);
var : direction(0),count_up(0),count_dn(0);
var : volatility(0),upper(0),lower(0),sig_up(False),sig_dn(False);
var : upper_band(0),lower_band(0);
var : hlc3(0),alpha(0),ATrv(0);
var :tx1(0),tx2(0);
var1 = ma(C,25);
var2 = ma(C,length);
hlc3 = (H+L+C)/3;
volatility = ma(high-low, 70) * factor;
upper = highest(var1 + volatility, int(length/2));
lower = lowest(var2 - volatility, int(length/2));
sig_up = CrossUp(hlc3, upper);
sig_dn = CrossDown(hlc3, lower);
if sig_up == true Then
direction = 1;
if sig_dn == true Then
direction = -1;
upper = iff(direction == 1 , Nan , upper);
lower = iff(direction == -1 , Nan , lower);
if direction == 1 Then
{
count_up = count_up+ 0.5;
count_dn = 0;
}
if direction == -1 Then
{
count_dn = count_dn+0.5;
count_up = 0;
}
count_up = iff(count_up > 70 , 70 , count_up);
count_dn = iff(count_dn > 70 , 70 , count_dn);
alpha = 1 / 100 ;
ATrV = IFf(IsNan(ATrV[1]) == true, ma(TrueRange,100) , alpha * TrueRange + (1 - alpha) * IFf(isnan(ATrV[1])==true,0,ATrV[1]));
upper_band = lower + ATRV*5;
lower_band = upper - ATRV*5;
if IsNaN(upper_band) == False Then
plot1(upper_band, "Wave",iff(index % 2 == 0 , nan , col_ul));
Else
plot1(lower_band, "Wave",iff(index % 2 == 0 , nan , col_ul));
if IsNaN(upper) == False Then
plot2(upper, "Band",col_dn);
Else
plot2(lower, "Band",col_up);
if direction != direction[1] and direction == 1 Then
{
tx1 = Text_New_Self(sDate,sTime,Lower,"●");
Text_SetStyle(tx1,2,2);
Text_SetColor(tx1,col_up);
tx2 = Text_New_Self(sDate,sTime,L,"▲");
Text_SetStyle(tx2,2,0);
Text_SetColor(tx2,col_up);
}
if direction != direction[1] and direction == -1 Then
{
tx1 = Text_New_Self(sDate,sTime,upper,"●");
Text_SetStyle(tx1,2,2);
Text_SetColor(tx1,col_dn);
tx2 = Text_New_Self(sDate,sTime,H,"▼");
Text_SetStyle(tx2,2,1);
Text_SetColor(tx2,col_dn);
}
즐거운 하루되세요
> 해암 님이 쓴 글입니다.
> 제목 : 문의드립니다.
> 이전에 다른 분이 문의한 내용에 대한 답을 아래와 같이 주셧습니다.
제게도 유용하다 싶어서 사용하보려 합니다.
그런데 차트에 적용해보니 첨부된 그림처럼 나오는데 동그라미 표시된 부분을 연결하려면 수식을 어떻게 수정해야 하는지요?
================
input : length(50);
input : factor(1.0);
input : col_up(lime);
input : col_dn(Red);
input : col_ul(Cyan);
var : direction(0),count_up(0),count_dn(0);
var : volatility(0),upper(0),lower(0),sig_up(False),sig_dn(False);
var : upper_band(0),lower_band(0);
var : hlc3(0),alpha(0),ATrv(0);
var :tx1(0),tx2(0);
var1 = ma(C,25);
var2 = ma(C,length);
hlc3 = (H+L+C)/3;
volatility = ma(high-low, 70) * factor;
upper = highest(var1 + volatility, int(length/2));
lower = lowest(var2 - volatility, int(length/2));
sig_up = CrossUp(hlc3, upper);
sig_dn = CrossDown(hlc3, lower);
if sig_up == true Then
direction = 1;
if sig_dn == true Then
direction = -1;
upper = iff(direction == 1 , Nan , upper);
lower = iff(direction == -1 , Nan , lower);
if direction == 1 Then
{
count_up = count_up+ 0.5;
count_dn = 0;
}
if direction == -1 Then
{
count_dn = count_dn+0.5;
count_up = 0;
}
count_up = iff(count_up > 70 , 70 , count_up);
count_dn = iff(count_dn > 70 , 70 , count_dn);
alpha = 1 / 100 ;
ATrV = IFf(IsNan(ATrV[1]) == true, ma(TrueRange,100) , alpha * TrueRange + (1 - alpha) * IFf(isnan(ATrV[1])==true,0,ATrV[1]));
upper_band = lower + ATRV*5;
lower_band = upper - ATRV*5;
if IsNaN(upper_band) == False Then
plot1(upper_band, "Upper Wave",iff(index % 2 == 0 , nan , col_ul));
Else
NoPlot(1);
if IsNaN(lower_band) == False Then
plot2(lower_band, "Lower Wave",iff(index % 2 == 0 , nan , col_ul));
Else
NoPlot(2);
if IsNaN(upper) == False Then
plot3(upper, "Upper Band",col_dn);
Else
NoPlot(3);
if IsNaN(lower) == False Then
plot4(lower, "Lower Band",col_up);
Else
NoPlot(4);
if direction != direction[1] and direction == 1 Then
{
tx1 = Text_New_Self(sDate,sTime,Lower,"●");
Text_SetStyle(tx1,2,2);
Text_SetColor(tx1,col_up);
tx2 = Text_New_Self(sDate,sTime,L,"▲");
Text_SetStyle(tx2,2,0);
Text_SetColor(tx2,col_up);
}
if direction != direction[1] and direction == -1 Then
{
tx1 = Text_New_Self(sDate,sTime,upper,"●");
Text_SetStyle(tx1,2,2);
Text_SetColor(tx1,col_dn);
tx2 = Text_New_Self(sDate,sTime,H,"▼");
Text_SetStyle(tx2,2,1);
Text_SetColor(tx2,col_dn);
}
=========================
항상 감사드립니다. 수고하세요!!!