커뮤니티
문의드립니다.

2025-06-06 03:53:26
1236
글번호 191473
첨부 이미지
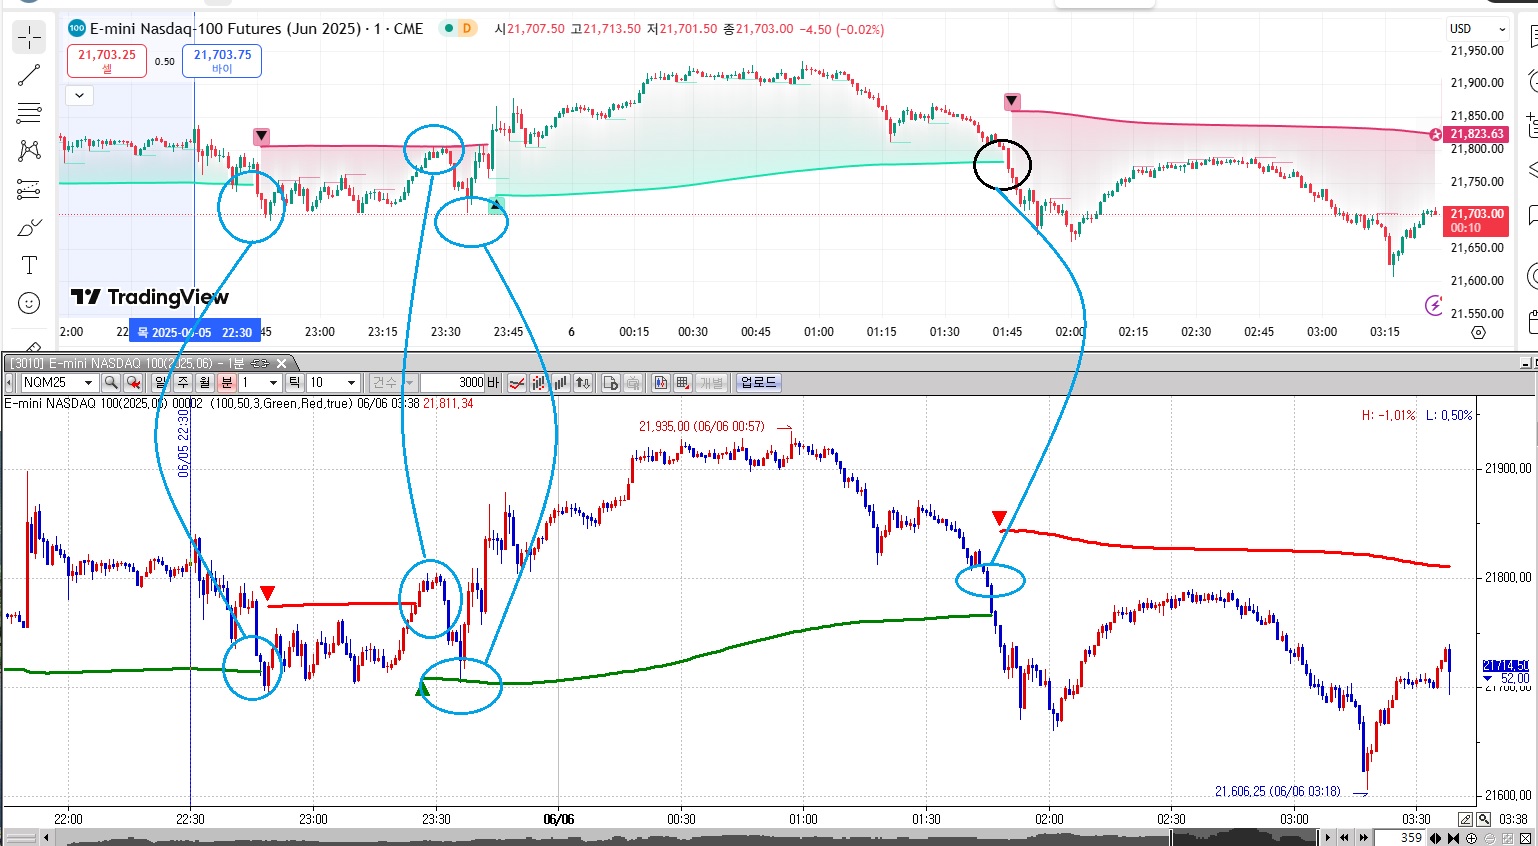
그림1

필요한 수식을 검색하던 중 이전에 어떤 분이 요청한 수식에 대한 답변(92732번)을 아래와 같이 주셔서 적용해봤는데(같은 기간값적용) 첨부된 그림과 같이 트레이딩뷰와 다른 부분이 나옵니다.
번거로우시겠지만 다시한번 검토해주시면 감사하겠습니다.
매번 도움을 받아서 감사드립니다.!!!
=============================
지표라인만 작성해 드립니다.
나머지 부가적인 표시들은 업무상 시간이 많이 소모되어 추가해 드리기 어렵습니다.
input : vidya_length(10);
input : vidya_momentum(20);
input : band_distance(2);
input : up_trend_color(Green);
input : down_trend_color(Red);
input : shadow(true);
var : pivot_left_bars(3),pivot_right_bars(0),source(0);
var : pivot_line(Nan);
var : volume_value(Nan);
var : smoothed_value(Nan);
var : is_trend_up(False);
var : up_trend_volume(False);
var : down_trend_volume(Nan);
Array : liquidity_lines_low[500](0),liquidity_lines_high[500](0);
pivot_left_bars = 3;
pivot_right_bars = 3;
source = close;
var : al(0),atr_value(0);
al = 1/200;
atr_value = IFf(IsNan(atr_value[1]) == true,ma(TrueRange, 200) , al * TrueRange + (1 - al) * IFf(IsNaN(atr_value[1])==true,0,atr_value[1]));
var : momentum(0),sum_pos_momentum(0),sum_neg_momentum(0),abs_cmo(0),alpha(0),vidya_v(0),vidya_value(0);
momentum = source-source[1];
sum_pos_momentum = AccumN(IFf(momentum >= 0, momentum , 0), vidya_momentum);
sum_neg_momentum = AccumN(IFf(momentum >= 0, 0, -momentum), vidya_momentum);
abs_cmo = abs(100 * (sum_pos_momentum - sum_neg_momentum) / (sum_pos_momentum + sum_neg_momentum));
alpha = 2 / (vidya_length + 1);
vidya_v = alpha * abs_cmo / 100 * source + (1 - alpha * abs_cmo / 100) * iff(IsNan(vidya_v[1])==true,0,vidya_v[1]);
vidya_value = ma(vidya_v, 15);
var : upper_band(0),lower_band(0);
upper_band = vidya_value + atr_value * band_distance;
lower_band = vidya_value - atr_value * band_distance;
// Detect trend direction using crossovers of source with bands
if CrossUp(source, upper_band) Then
is_trend_up = true ;
if CrossDown(source, lower_band) Then
is_trend_up = false ;
// Set trend-based smoothing variable
if is_trend_up == true Then
smoothed_value = lower_band;
if is_trend_up == False Then
smoothed_value = upper_band;
if is_trend_up != is_trend_up[1] Then
smoothed_value = Nan;
// Calculate pivot highs and lows for price action
var : pivot_high(0),pivot_low(0);
pivot_high = SwingHigh(1,high,pivot_left_bars, pivot_right_bars,pivot_left_bars+pivot_right_bars+1);
pivot_low = SwingLow(1, close, pivot_left_bars, pivot_right_bars,pivot_left_bars+pivot_right_bars+1);
if smoothed_value > 0 Then
plot1(smoothed_value,"smoothed_value",iff(is_trend_up , up_trend_color ,down_trend_color));
Else
NoPlot(1);
var : tx(0);
if is_trend_up == is_trend_up[1] and is_trend_up[1] != is_trend_up[2] Then
{
if is_trend_up == true Then
{
tx = Text_New(sDate,sTime,smoothed_value,"▲");
Text_SetStyle(tx,2,0);
Text_SetColor(tx,up_trend_color);
Text_SetSize(tx,20);
}
if is_trend_up == False Then
{
tx = Text_New(sDate,sTime,smoothed_value,"▼");
Text_SetStyle(tx,2,1);
Text_SetColor(tx,down_trend_color);
Text_SetSize(tx,20);
}
}
================
트레이딩뷰 수식
//@version=6
indicator('Volumatic Variable Index Dynamic Average [BigBeluga]', 'Volumatic VIDYA [BigBeluga]', overlay = true, max_lines_count = 500, max_labels_count = 500)
// INPUTS ――――――――――――――――――――――――――――――――――――――――――――――――――――――――――――――――――――――――――――――――――――――――――――――――――――――――{
// Input parameters for length, momentum, and source data
int vidya_length = input.int(10, 'VIDYA Length') // Length of the VIDYA calculation
int vidya_momentum = input.int(20, 'VIDYA Momentum') // Momentum length for VIDYA
float band_distance = input.float(2, 'Distance factor for upper/lower bands', step = 0.1) // Distance factor for upper/lower bands
// Define pivot parameters
int pivot_left_bars = 3 // Left side pivot bars
int pivot_right_bars = pivot_left_bars // Right side pivot bars
float source = input.source(close, 'Source') // Source for VIDYA calculation
// Define colors for up and down trends
color up_trend_color = input(#17dfad, '+', group = 'Color', inline = 'c') // Color for uptrend
color down_trend_color = input(#dd326b, '-', group = 'Color', inline = 'c') // Color for downtrend
bool shadow = input.bool(true, 'Shadow', group = 'Color', inline = 'c')
// Initialize variables for line, volume, and trend state
var line pivot_line = na // Variable for storing line references
var float volume_value = na // Variable for storing volume data
float smoothed_value = na // Smoothing variable for VIDYA trend levels
var bool is_trend_up = false // Boolean variable for tracking trend direction
// Initialize arrays for storing line and volume information
var array<line> liquidity_lines_low = array.new<line>(500) // Array for storing lines for lows
var array<line> liquidity_lines_high = array.new<line>(500) // Array for storing lines for highs
var float up_trend_volume = na // Volume accumulated during uptrend
var float down_trend_volume = na // Volume accumulated during downtrend
// }
// FUNCTIONS―――――――――――――――――――――――――――――――――――――――――――――――――――――――――――――――――――――――――――――――――――――――――――――――――――――――――――――{
// Define VIDYA (Variable Index Dynamic Average) function
vidya_calc(src, vidya_length, vidya_momentum) =>
float momentum = ta.change(src)
float sum_pos_momentum = math.sum(momentum >= 0 ? momentum : 0.0, vidya_momentum)
float sum_neg_momentum = math.sum(momentum >= 0 ? 0.0 : -momentum, vidya_momentum)
float abs_cmo = math.abs(100 * (sum_pos_momentum - sum_neg_momentum) / (sum_pos_momentum + sum_neg_momentum))
float alpha = 2 / (vidya_length + 1)
var float vidya_value = 0.0
vidya_value := alpha * abs_cmo / 100 * src + (1 - alpha * abs_cmo / 100) * nz(vidya_value[1])
ta.sma(vidya_value, 15)
// Method to extend lines and add labels for liquidity levels
method extend_liquidity_lines(array<line> line_array, float price_level, bool is_cross, volume_val) =>
if line_array.size() > 0 and last_bar_index - bar_index < 5000
for i = 0 to line_array.size() - 1 by 1
if i < line_array.size()
line liquidity_line = line_array.get(i)
float current_line_level = line.get_y2(liquidity_line)
bool price_cross = is_cross ? price_level < current_line_level and price_level[1] >= current_line_level : price_level > current_line_level and price_level[1] <= current_line_level
bool is_short_line = bar_index - line.get_x1(liquidity_line) < 50
if price_cross and is_short_line
line.set_x2(liquidity_line, bar_index)
line_array.remove(i)
// Add volume label to the liquidity zone
label.new(bar_index - 1, price_level[1], str.tostring(volume_val, format.volume), color = color.rgb(0, 0, 0, 99), style = is_cross ? label.style_label_lower_left : label.style_label_upper_left, textcolor = chart.fg_color, size = size.small)
// Add a circle label to represent liquidity zone
label.new(bar_index - 1, price_level[1], text = '◉', color = #00000003, textcolor = is_cross ? down_trend_color : up_trend_color, style = label.style_label_center, size = size.normal)
// }
// CALCULATIONS――――――――――――――――――――――――――――――――――――――――――――――――――――――――――――――――――――――――――――――――――――――――――――――{
// Calculate the Average True Range (ATR)
float atr_value = ta.atr(200) // ATR calculation with length of 200
// Calculate the VIDYA (Variable Index Dynamic Average)
vidya_value = vidya_calc(source, vidya_length, vidya_momentum)
// Calculate upper and lower bands based on VIDYA and ATR
float upper_band = vidya_value + atr_value * band_distance
float lower_band = vidya_value - atr_value * band_distance
// Detect trend direction using crossovers of source with bands
if ta.crossover(source, upper_band)
is_trend_up := true
is_trend_up
if ta.crossunder(source, lower_band)
is_trend_up := false
is_trend_up
// Set trend-based smoothing variable
if is_trend_up
smoothed_value := lower_band
smoothed_value
if not is_trend_up
smoothed_value := upper_band
smoothed_value
if ta.change(is_trend_up)
smoothed_value := na
smoothed_value
// Calculate pivot highs and lows for price action
bool pivot_high = not na(ta.pivothigh(pivot_left_bars, pivot_right_bars))
bool pivot_low = not na(ta.pivotlow(close, pivot_left_bars, pivot_right_bars))
// Create and store lines for pivot lows (support zones)
if low[pivot_right_bars] > smoothed_value and pivot_low
pivot_line := line.new(bar_index[pivot_right_bars], low[pivot_right_bars], bar_index[pivot_right_bars] + 5, low[pivot_right_bars], color = color.new(up_trend_color, 50))
liquidity_lines_low.push(pivot_line)
volume_value := math.sum(volume, pivot_right_bars + pivot_left_bars) / (pivot_right_bars + pivot_left_bars)
volume_value
// Create and store lines for pivot highs (resistance zones)
if high[pivot_right_bars] < smoothed_value and pivot_high
pivot_line := line.new(bar_index[pivot_right_bars], high[pivot_right_bars], bar_index[pivot_right_bars] + 5, high[pivot_right_bars], color = color.new(down_trend_color, 50))
liquidity_lines_high.push(pivot_line)
volume_value := math.sum(-volume, pivot_right_bars + pivot_left_bars) / (pivot_right_bars + pivot_left_bars)
volume_value
// Extend lines to track price movements
liquidity_lines_high.extend_liquidity_lines(smoothed_value, true, volume_value)
liquidity_lines_low.extend_liquidity_lines(smoothed_value, false, volume_value)
// Detect changes in the trend direction
bool trend_cross_up = not is_trend_up[1] and is_trend_up
bool trend_cross_down = not is_trend_up and is_trend_up[1]
// Reset volume counters when trend changes
if ta.change(trend_cross_up) or ta.change(trend_cross_down)
up_trend_volume := 0
down_trend_volume := 0
down_trend_volume
// Accumulate volume during trends
if not(ta.change(trend_cross_up) or ta.change(trend_cross_down))
up_trend_volume := up_trend_volume + (close > open ? volume : 0)
down_trend_volume := down_trend_volume + (close < open ? volume : 0)
down_trend_volume
// Calculate average volume
float avg_volume_delta = (up_trend_volume + down_trend_volume) / 2
// Determine the color of the trend
color trend_color = is_trend_up ? up_trend_color : not is_trend_up ? down_trend_color : chart.fg_color
// Calculate delta volume percentage
string delta_volume = str.tostring((up_trend_volume - down_trend_volume) / avg_volume_delta * 100, format.percent) == 'NaN%' ? '0%' : str.tostring((up_trend_volume - down_trend_volume) / avg_volume_delta * 100, format.percent)
// }
// PLOT ――――――――――――――――――――――――――――――――――――――――――――――――――――――――――――――――――――――――――――――――――――――――――――――――――――――――――――{
// Display labels for volume and trend statistics on the last bar
if barstate.islast
label.delete(label.new(bar_index, smoothed_value, 'Buy: ' + str.tostring(up_trend_volume, format.volume) + '₩n Sell: ' + str.tostring(down_trend_volume, format.volume) + '₩nDelta Volume: ' + delta_volume, color = color.new(trend_color, 90), style = is_trend_up ? label.style_label_upper_left : label.style_label_lower_left, textcolor = chart.fg_color)[1])
label.delete(label.new(bar_index, smoothed_value, text = '✪', color = #00000003, textcolor = trend_color, style = label.style_label_center, size = size.large)[1])
// Plot the VIDYA trend line
p1 = plot(smoothed_value, color = trend_color, linewidth = 2, style = plot.style_linebr)
p2 = plot(hl2, display = display.none)
// Fill between the plot and the VIDYA line
fill(p1, p2, smoothed_value, hl2, color.new(trend_color, shadow ? 80 : 100), na)
// Plot trend change markers (up and down arrows)
plotshape(series = trend_cross_up[1] ? smoothed_value[0] : na, title = 'Trend Up', style = shape.labelup, location = location.absolute, color = color.new(up_trend_color, 50), text = '▲', textcolor = chart.fg_color)
plotshape(series = trend_cross_down[1] ? smoothed_value[0] : na, title = 'Trend Down', style = shape.labeldown, location = location.absolute, color = color.new(down_trend_color, 50), text = '▼', textcolor = chart.fg_color)
// }
- 1. 2_6월6일_문의.jpg (0.33 MB)
답변 1

예스스탁 예스스탁 답변
2025-06-09 15:32:28
안녕하세요
예스스탁입니다.
삼성전자나 코스피 지수에 적용해 보면 트레이딩뷰와 동일하게 그려지고 있습니다.
아마 데이터에 따른 차이가 있는 것 같은데 정확히
해당식 수식상 어느 부분이 다른지 모르겠습니다.
즐거운 하루되세요
> 해암 님이 쓴 글입니다.
> 제목 : 문의드립니다.
> 필요한 수식을 검색하던 중 이전에 어떤 분이 요청한 수식에 대한 답변(92732번)을 아래와 같이 주셔서 적용해봤는데(같은 기간값적용) 첨부된 그림과 같이 트레이딩뷰와 다른 부분이 나옵니다.
번거로우시겠지만 다시한번 검토해주시면 감사하겠습니다.
매번 도움을 받아서 감사드립니다.!!!
=============================
지표라인만 작성해 드립니다.
나머지 부가적인 표시들은 업무상 시간이 많이 소모되어 추가해 드리기 어렵습니다.
input : vidya_length(10);
input : vidya_momentum(20);
input : band_distance(2);
input : up_trend_color(Green);
input : down_trend_color(Red);
input : shadow(true);
var : pivot_left_bars(3),pivot_right_bars(0),source(0);
var : pivot_line(Nan);
var : volume_value(Nan);
var : smoothed_value(Nan);
var : is_trend_up(False);
var : up_trend_volume(False);
var : down_trend_volume(Nan);
Array : liquidity_lines_low[500](0),liquidity_lines_high[500](0);
pivot_left_bars = 3;
pivot_right_bars = 3;
source = close;
var : al(0),atr_value(0);
al = 1/200;
atr_value = IFf(IsNan(atr_value[1]) == true,ma(TrueRange, 200) , al * TrueRange + (1 - al) * IFf(IsNaN(atr_value[1])==true,0,atr_value[1]));
var : momentum(0),sum_pos_momentum(0),sum_neg_momentum(0),abs_cmo(0),alpha(0),vidya_v(0),vidya_value(0);
momentum = source-source[1];
sum_pos_momentum = AccumN(IFf(momentum >= 0, momentum , 0), vidya_momentum);
sum_neg_momentum = AccumN(IFf(momentum >= 0, 0, -momentum), vidya_momentum);
abs_cmo = abs(100 * (sum_pos_momentum - sum_neg_momentum) / (sum_pos_momentum + sum_neg_momentum));
alpha = 2 / (vidya_length + 1);
vidya_v = alpha * abs_cmo / 100 * source + (1 - alpha * abs_cmo / 100) * iff(IsNan(vidya_v[1])==true,0,vidya_v[1]);
vidya_value = ma(vidya_v, 15);
var : upper_band(0),lower_band(0);
upper_band = vidya_value + atr_value * band_distance;
lower_band = vidya_value - atr_value * band_distance;
// Detect trend direction using crossovers of source with bands
if CrossUp(source, upper_band) Then
is_trend_up = true ;
if CrossDown(source, lower_band) Then
is_trend_up = false ;
// Set trend-based smoothing variable
if is_trend_up == true Then
smoothed_value = lower_band;
if is_trend_up == False Then
smoothed_value = upper_band;
if is_trend_up != is_trend_up[1] Then
smoothed_value = Nan;
// Calculate pivot highs and lows for price action
var : pivot_high(0),pivot_low(0);
pivot_high = SwingHigh(1,high,pivot_left_bars, pivot_right_bars,pivot_left_bars+pivot_right_bars+1);
pivot_low = SwingLow(1, close, pivot_left_bars, pivot_right_bars,pivot_left_bars+pivot_right_bars+1);
if smoothed_value > 0 Then
plot1(smoothed_value,"smoothed_value",iff(is_trend_up , up_trend_color ,down_trend_color));
Else
NoPlot(1);
var : tx(0);
if is_trend_up == is_trend_up[1] and is_trend_up[1] != is_trend_up[2] Then
{
if is_trend_up == true Then
{
tx = Text_New(sDate,sTime,smoothed_value,"▲");
Text_SetStyle(tx,2,0);
Text_SetColor(tx,up_trend_color);
Text_SetSize(tx,20);
}
if is_trend_up == False Then
{
tx = Text_New(sDate,sTime,smoothed_value,"▼");
Text_SetStyle(tx,2,1);
Text_SetColor(tx,down_trend_color);
Text_SetSize(tx,20);
}
}
================
트레이딩뷰 수식
//@version=6
indicator('Volumatic Variable Index Dynamic Average [BigBeluga]', 'Volumatic VIDYA [BigBeluga]', overlay = true, max_lines_count = 500, max_labels_count = 500)
// INPUTS ――――――――――――――――――――――――――――――――――――――――――――――――――――――――――――――――――――――――――――――――――――――――――――――――――――――――{
// Input parameters for length, momentum, and source data
int vidya_length = input.int(10, 'VIDYA Length') // Length of the VIDYA calculation
int vidya_momentum = input.int(20, 'VIDYA Momentum') // Momentum length for VIDYA
float band_distance = input.float(2, 'Distance factor for upper/lower bands', step = 0.1) // Distance factor for upper/lower bands
// Define pivot parameters
int pivot_left_bars = 3 // Left side pivot bars
int pivot_right_bars = pivot_left_bars // Right side pivot bars
float source = input.source(close, 'Source') // Source for VIDYA calculation
// Define colors for up and down trends
color up_trend_color = input(#17dfad, '+', group = 'Color', inline = 'c') // Color for uptrend
color down_trend_color = input(#dd326b, '-', group = 'Color', inline = 'c') // Color for downtrend
bool shadow = input.bool(true, 'Shadow', group = 'Color', inline = 'c')
// Initialize variables for line, volume, and trend state
var line pivot_line = na // Variable for storing line references
var float volume_value = na // Variable for storing volume data
float smoothed_value = na // Smoothing variable for VIDYA trend levels
var bool is_trend_up = false // Boolean variable for tracking trend direction
// Initialize arrays for storing line and volume information
var array<line> liquidity_lines_low = array.new<line>(500) // Array for storing lines for lows
var array<line> liquidity_lines_high = array.new<line>(500) // Array for storing lines for highs
var float up_trend_volume = na // Volume accumulated during uptrend
var float down_trend_volume = na // Volume accumulated during downtrend
// }
// FUNCTIONS―――――――――――――――――――――――――――――――――――――――――――――――――――――――――――――――――――――――――――――――――――――――――――――――――――――――――――――{
// Define VIDYA (Variable Index Dynamic Average) function
vidya_calc(src, vidya_length, vidya_momentum) =>
float momentum = ta.change(src)
float sum_pos_momentum = math.sum(momentum >= 0 ? momentum : 0.0, vidya_momentum)
float sum_neg_momentum = math.sum(momentum >= 0 ? 0.0 : -momentum, vidya_momentum)
float abs_cmo = math.abs(100 * (sum_pos_momentum - sum_neg_momentum) / (sum_pos_momentum + sum_neg_momentum))
float alpha = 2 / (vidya_length + 1)
var float vidya_value = 0.0
vidya_value := alpha * abs_cmo / 100 * src + (1 - alpha * abs_cmo / 100) * nz(vidya_value[1])
ta.sma(vidya_value, 15)
// Method to extend lines and add labels for liquidity levels
method extend_liquidity_lines(array<line> line_array, float price_level, bool is_cross, volume_val) =>
if line_array.size() > 0 and last_bar_index - bar_index < 5000
for i = 0 to line_array.size() - 1 by 1
if i < line_array.size()
line liquidity_line = line_array.get(i)
float current_line_level = line.get_y2(liquidity_line)
bool price_cross = is_cross ? price_level < current_line_level and price_level[1] >= current_line_level : price_level > current_line_level and price_level[1] <= current_line_level
bool is_short_line = bar_index - line.get_x1(liquidity_line) < 50
if price_cross and is_short_line
line.set_x2(liquidity_line, bar_index)
line_array.remove(i)
// Add volume label to the liquidity zone
label.new(bar_index - 1, price_level[1], str.tostring(volume_val, format.volume), color = color.rgb(0, 0, 0, 99), style = is_cross ? label.style_label_lower_left : label.style_label_upper_left, textcolor = chart.fg_color, size = size.small)
// Add a circle label to represent liquidity zone
label.new(bar_index - 1, price_level[1], text = '◉', color = #00000003, textcolor = is_cross ? down_trend_color : up_trend_color, style = label.style_label_center, size = size.normal)
// }
// CALCULATIONS――――――――――――――――――――――――――――――――――――――――――――――――――――――――――――――――――――――――――――――――――――――――――――――{
// Calculate the Average True Range (ATR)
float atr_value = ta.atr(200) // ATR calculation with length of 200
// Calculate the VIDYA (Variable Index Dynamic Average)
vidya_value = vidya_calc(source, vidya_length, vidya_momentum)
// Calculate upper and lower bands based on VIDYA and ATR
float upper_band = vidya_value + atr_value * band_distance
float lower_band = vidya_value - atr_value * band_distance
// Detect trend direction using crossovers of source with bands
if ta.crossover(source, upper_band)
is_trend_up := true
is_trend_up
if ta.crossunder(source, lower_band)
is_trend_up := false
is_trend_up
// Set trend-based smoothing variable
if is_trend_up
smoothed_value := lower_band
smoothed_value
if not is_trend_up
smoothed_value := upper_band
smoothed_value
if ta.change(is_trend_up)
smoothed_value := na
smoothed_value
// Calculate pivot highs and lows for price action
bool pivot_high = not na(ta.pivothigh(pivot_left_bars, pivot_right_bars))
bool pivot_low = not na(ta.pivotlow(close, pivot_left_bars, pivot_right_bars))
// Create and store lines for pivot lows (support zones)
if low[pivot_right_bars] > smoothed_value and pivot_low
pivot_line := line.new(bar_index[pivot_right_bars], low[pivot_right_bars], bar_index[pivot_right_bars] + 5, low[pivot_right_bars], color = color.new(up_trend_color, 50))
liquidity_lines_low.push(pivot_line)
volume_value := math.sum(volume, pivot_right_bars + pivot_left_bars) / (pivot_right_bars + pivot_left_bars)
volume_value
// Create and store lines for pivot highs (resistance zones)
if high[pivot_right_bars] < smoothed_value and pivot_high
pivot_line := line.new(bar_index[pivot_right_bars], high[pivot_right_bars], bar_index[pivot_right_bars] + 5, high[pivot_right_bars], color = color.new(down_trend_color, 50))
liquidity_lines_high.push(pivot_line)
volume_value := math.sum(-volume, pivot_right_bars + pivot_left_bars) / (pivot_right_bars + pivot_left_bars)
volume_value
// Extend lines to track price movements
liquidity_lines_high.extend_liquidity_lines(smoothed_value, true, volume_value)
liquidity_lines_low.extend_liquidity_lines(smoothed_value, false, volume_value)
// Detect changes in the trend direction
bool trend_cross_up = not is_trend_up[1] and is_trend_up
bool trend_cross_down = not is_trend_up and is_trend_up[1]
// Reset volume counters when trend changes
if ta.change(trend_cross_up) or ta.change(trend_cross_down)
up_trend_volume := 0
down_trend_volume := 0
down_trend_volume
// Accumulate volume during trends
if not(ta.change(trend_cross_up) or ta.change(trend_cross_down))
up_trend_volume := up_trend_volume + (close > open ? volume : 0)
down_trend_volume := down_trend_volume + (close < open ? volume : 0)
down_trend_volume
// Calculate average volume
float avg_volume_delta = (up_trend_volume + down_trend_volume) / 2
// Determine the color of the trend
color trend_color = is_trend_up ? up_trend_color : not is_trend_up ? down_trend_color : chart.fg_color
// Calculate delta volume percentage
string delta_volume = str.tostring((up_trend_volume - down_trend_volume) / avg_volume_delta * 100, format.percent) == 'NaN%' ? '0%' : str.tostring((up_trend_volume - down_trend_volume) / avg_volume_delta * 100, format.percent)
// }
// PLOT ――――――――――――――――――――――――――――――――――――――――――――――――――――――――――――――――――――――――――――――――――――――――――――――――――――――――――――{
// Display labels for volume and trend statistics on the last bar
if barstate.islast
label.delete(label.new(bar_index, smoothed_value, 'Buy: ' + str.tostring(up_trend_volume, format.volume) + '₩n Sell: ' + str.tostring(down_trend_volume, format.volume) + '₩nDelta Volume: ' + delta_volume, color = color.new(trend_color, 90), style = is_trend_up ? label.style_label_upper_left : label.style_label_lower_left, textcolor = chart.fg_color)[1])
label.delete(label.new(bar_index, smoothed_value, text = '✪', color = #00000003, textcolor = trend_color, style = label.style_label_center, size = size.large)[1])
// Plot the VIDYA trend line
p1 = plot(smoothed_value, color = trend_color, linewidth = 2, style = plot.style_linebr)
p2 = plot(hl2, display = display.none)
// Fill between the plot and the VIDYA line
fill(p1, p2, smoothed_value, hl2, color.new(trend_color, shadow ? 80 : 100), na)
// Plot trend change markers (up and down arrows)
plotshape(series = trend_cross_up[1] ? smoothed_value[0] : na, title = 'Trend Up', style = shape.labelup, location = location.absolute, color = color.new(up_trend_color, 50), text = '▲', textcolor = chart.fg_color)
plotshape(series = trend_cross_down[1] ? smoothed_value[0] : na, title = 'Trend Down', style = shape.labeldown, location = location.absolute, color = color.new(down_trend_color, 50), text = '▼', textcolor = chart.fg_color)
// }
다음글
이전글