커뮤니티
지표 변환 부탁드립니다

2024-08-01 23:47:03
1549
글번호 182178
첨부 이미지
그림1

매번 바쁘신데 감사드립니다.
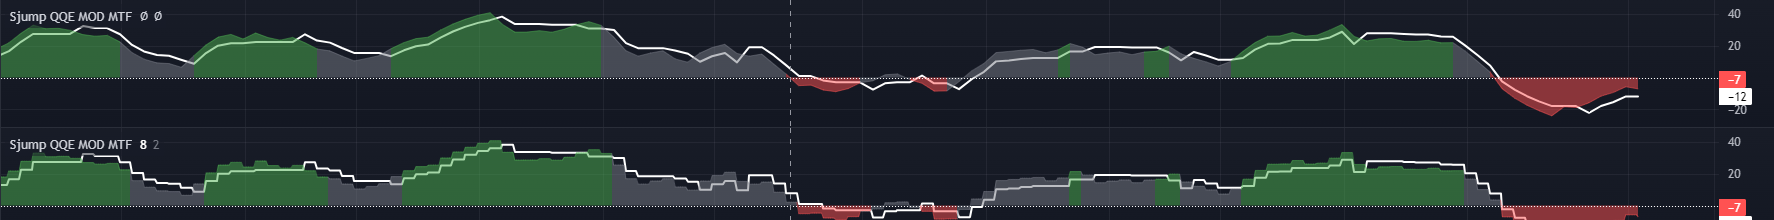
QQE MOD 지표인데 multi time frame 버전입니다.
차트주기와 타주기 모두 표현 가능하고, 그래프가 첨부사진 위와 아래처럼 두 가지 모습 모두 가능한지 궁금합니다.
트레이딩뷰 지표인데 예스랭귀지로 변환 가능한지 문의드립니다.
indicator("SuperJump QQE MOD MTF", shorttitle = "Sjump QQE MOD MTF", timeframe="",timeframe_gaps =true)
RSI_Period = input.int(6, title='RSI Length')
SF = input.int(5, title='RSI Smoothing')
QQE = input.int(3, title='Fast QQE Factor')
ThreshHold = input.int(3, title="Threshold")
src = input.source(close, title="RSI Source")
QQELongColor = input.color(color.new(color.green,50), "QQE Long")
QQEShortColor = input.color(color.new(color.red,50), "QQE Short")
QQEWeakColor = input.color(color.new(color.gray,50), "QQE Weak")
isFillBackGround = input.bool(false,"Fill BackGround for higherTimeFrame")
GetQQEDefaultValue(_src, _rsi_period, _sf, _qqe) =>
_Wilders_Period = _rsi_period * 2 - 1
_RSI = ta.rsi(_src, _rsi_period)
_RsiMa = ta.ema(_RSI, _sf)
_AtrRsi = math.abs(_RsiMa[1] - _RsiMa)
_MaAtrRsi = ta.ema(_AtrRsi, _Wilders_Period)
_dar = ta.ema(_MaAtrRsi, _Wilders_Period) * _qqe
[_Wilders_Period, _RSI, _RsiMa, _AtrRsi, _dar]
[Wilders_Period, Rsi,RsiMa,AtrRsi,dar] = GetQQEDefaultValue(src, RSI_Period, SF, QQE)
GetFastAtrRsiTL(_dar, _RsiMa)=>
longband = 0.0
shortband = 0.0
trend = 0
DeltaFastAtrRsi = _dar
RSIndex = _RsiMa
newshortband = RSIndex + DeltaFastAtrRsi
newlongband = RSIndex - DeltaFastAtrRsi
longband := RSIndex[1] > longband[1] and RSIndex > longband[1] ? math.max(longband[1], newlongband) : newlongband
shortband := RSIndex[1] < shortband[1] and RSIndex < shortband[1] ? math.min(shortband[1], newshortband) : newshortband
cross_1 = ta.cross(longband[1], RSIndex)
trend := ta.cross(RSIndex, shortband[1]) ? 1 : cross_1 ? -1 : nz(trend[1], 1)
FastAtrRsiTL = trend == 1 ? longband : shortband
FastAtrRsiTL = GetFastAtrRsiTL(dar, RsiMa)
length = input.int(50, minval=1, title="Bollinger Length")
mult = input.float(0.35, minval=0.001, maxval=5, step=0.1, title="BB Multiplier")
basis = ta.sma(FastAtrRsiTL - 50, length)
dev = mult * ta.stdev(FastAtrRsiTL - 50, length)
upper = basis + dev
lower = basis - dev
Zero = hline(0, color=color.white, linestyle=hline.style_dotted, linewidth=1)
////////////////////////////////////////////////////////////////
RSI_Period2 = input(6, title='RSI Length')
SF2 = input(5, title='RSI Smoothing')
QQE2 = input(1.61, title='Fast QQE2 Factor')
ThresHold2 = input(3, title="Threshold")
src2 = input(close, title="RSI Source")
[Wilders_Period2, Rsi2,RsiMa2,AtrRsi2,dar2] = GetQQEDefaultValue(src2, RSI_Period2, SF2, QQE2)
FastAtrRsi2TL = GetFastAtrRsiTL(dar2, RsiMa2)
Greenbar1 = RsiMa2 - 50 > ThresHold2
Greenbar2 = RsiMa - 50 > upper
Redbar1 = RsiMa2 - 50 < 0 - ThresHold2
Redbar2 = RsiMa - 50 < lower
isLongTrend = Greenbar1 and Greenbar2 == 1
isShortTrend = Redbar1 and Redbar2 == 1
plot(isFillBackGround == false? FastAtrRsi2TL - 50:na , title='QQE Line', color=color.white, transp=0, linewidth=2)
plot(isFillBackGround == false ? RsiMa2 - 50 :na , title="QQE Area", style=plot.style_area, color= isLongTrend ? QQELongColor : isShortTrend ? QQEShortColor : QQEWeakColor)
isLongSignal = FastAtrRsi2TL - 50 >=0 and ta.crossunder(RsiMa2 - 50,FastAtrRsi2TL - 50) and isFillBackGround == false
isShortSignal = FastAtrRsi2TL - 50 <0 and ta.crossover(RsiMa2 - 50,FastAtrRsi2TL - 50) and isFillBackGround == false
감사합니다!
- 1. QQE_mtf.png (0.07 MB)
답변 1

예스스탁 예스스탁 답변
2024-08-02 15:18:17
안녕하세요
예스스탁입니다.
1
지표사이의 색을 채우는 부분은 수식에서 처리가 되지 않습니다.
지표속성창의 차트표시탭에서 채우기 기능이용해 직접 설정하셔야 합니다.
2
타주기는 작성해 드리기 어렵습니다.
3
input : RSI_Period(6);
input : SF(5);
input : QQE(3);
input : ThreshHold(3);
input : QQELongColor(green);
input : QQEShortColor(red);
input : QQEWeakColor(gray);
input : isFillBackGround(false);
input : length(50);
input : mult(0.35);
var : src(0);
input : RSI_Period2(6);
input : SF2(5);
input : QQE2(1.61);
input : ThresHold2(3);
var : src2(0);
var : basis(0),dev(0),upper(0),lower(0);
src = close;
var : Wilders_Period(0),R(0),RsiMa(0),AtrRsi(0),MaAtrRsi(0),dar(0);
var : Wilders_Period2(0),R2(0),RsiMa2(0),AtrRsi2(0),MaAtrRsi2(0),dar2(0);
Wilders_Period = rsi_period * 2 - 1;
R = rsi(rsi_period);
RsiMa = ema(R, sf);
AtrRsi = abs(RsiMa[1] - RsiMa);
MaAtrRsi = ema(AtrRsi, Wilders_Period);
dar = ema(MaAtrRsi, Wilders_Period) * qqe;
Wilders_Period2 = rsi_period2 * 2 - 1;
R2 = rsi(rsi_period2);
RsiMa2 = ema(R2, sf2);
AtrRsi2 = abs(RsiMa2[1] - RsiMa2);
MaAtrRsi2 = ema(AtrRsi2, Wilders_Period2);
dar2 = ema(MaAtrRsi2, Wilders_Period2) * qqe2;
var : longband(0),shortband(0),trend(0),DeltaFastAtrRsi(0),RSIndex(0);
var : newshortband(0),newlongband(0),cross_1(False),FastAtrRsiTL(0);
var : longband2(0),shortband2(0),trend2(0),DeltaFastAtrRsi2(0),RSIndex2(0);
var : newshortband2(0),newlongband2(0),cross_2(False),FastAtrRsi2TL(0);
longband = 0.0;
shortband = 0.0;
trend = 0;
DeltaFastAtrRsi = dar;
RSIndex = RsiMa;
newshortband = RSIndex + DeltaFastAtrRsi;
newlongband = RSIndex - DeltaFastAtrRsi;
longband = iff(RSIndex[1] > longband[1] and RSIndex > longband[1] , max(longband[1], newlongband) , newlongband);
shortband = IFf(RSIndex[1] < shortband[1] and RSIndex < shortband[1] , min(shortband[1], newshortband) , newshortband);
cross_1 = CrossUp(longband[1], RSIndex)or CrossDown(longband[1], RSIndex);
trend = iff(CrossUp(RSIndex, shortband[1]) or CrossDown(RSIndex, shortband[1]) , 1 ,IFf(cross_1 , -1 ,iff(IsNaN(trend[1]) == true, 1,trend[1])));
FastAtrRsiTL = iff(trend == 1 , longband , shortband);
longband2 = 0.0;
shortband2 = 0.0;
trend2 = 0;
DeltaFastAtrRsi2 = dar2;
RSIndex2 = RsiMa2;
newshortband2 = RSIndex2 + DeltaFastAtrRsi2;
newlongband2 = RSIndex2 - DeltaFastAtrRsi2;
longband2 = iff(RSIndex2[1] > longband2[1] and RSIndex2 > longband2[1] , max(longband2[1], newlongband2) , newlongband2);
shortband2 = IFf(RSIndex2[1] < shortband2[1] and RSIndex2 < shortband2[1] , min(shortband2[1], newshortband2) , newshortband2);
cross_2 = CrossUp(longband2[1], RSIndex2)or CrossDown(longband2[1], RSIndex2);
trend2 = iff(CrossUp(RSIndex2, shortband2[1]) or CrossDown(RSIndex2, shortband2[1]) , 1 ,IFf(cross_2 , -1 ,iff(IsNaN(trend2[1]) == true, 1,trend2[1])));
FastAtrRsi2TL = iff(trend2 == 1 , longband2, shortband2);
basis = ma(FastAtrRsiTL - 50, length);
dev = mult * std(FastAtrRsiTL - 50, length);
upper = basis + dev;
lower = basis - dev;
src2 = close;
var : Greenbar1(False),Greenbar2(False);
var : redbar1(False),redbar2(False);
var : isLongTrend(False),isShortTrend(False);
Greenbar1 = RsiMa2 - 50 > ThresHold2;
Greenbar2 = RsiMa - 50 > upper;
Redbar1 = RsiMa2 - 50 < 0 - ThresHold2;
Redbar2 = RsiMa - 50 < lower;
isLongTrend = Greenbar1 and Greenbar2 == 1 ;
isShortTrend = Redbar1 and Redbar2 == 1 ;
PlotBaseLine1(0);
plot1(FastAtrRsi2TL - 50,"QQE Line");
plot2(RsiMa2 - 50 ,"QQE Area",IFF(isLongTrend , QQELongColor , IFf(isShortTrend , QQEShortColor , QQEWeakColor)));
즐거운 하루되세요
> 트레트레 님이 쓴 글입니다.
> 제목 : 지표 변환 부탁드립니다
> 매번 바쁘신데 감사드립니다.
QQE MOD 지표인데 multi time frame 버전입니다.
차트주기와 타주기 모두 표현 가능하고, 그래프가 첨부사진 위와 아래처럼 두 가지 모습 모두 가능한지 궁금합니다.
트레이딩뷰 지표인데 예스랭귀지로 변환 가능한지 문의드립니다.
indicator("SuperJump QQE MOD MTF", shorttitle = "Sjump QQE MOD MTF", timeframe="",timeframe_gaps =true)
RSI_Period = input.int(6, title='RSI Length')
SF = input.int(5, title='RSI Smoothing')
QQE = input.int(3, title='Fast QQE Factor')
ThreshHold = input.int(3, title="Threshold")
src = input.source(close, title="RSI Source")
QQELongColor = input.color(color.new(color.green,50), "QQE Long")
QQEShortColor = input.color(color.new(color.red,50), "QQE Short")
QQEWeakColor = input.color(color.new(color.gray,50), "QQE Weak")
isFillBackGround = input.bool(false,"Fill BackGround for higherTimeFrame")
GetQQEDefaultValue(_src, _rsi_period, _sf, _qqe) =>
_Wilders_Period = _rsi_period * 2 - 1
_RSI = ta.rsi(_src, _rsi_period)
_RsiMa = ta.ema(_RSI, _sf)
_AtrRsi = math.abs(_RsiMa[1] - _RsiMa)
_MaAtrRsi = ta.ema(_AtrRsi, _Wilders_Period)
_dar = ta.ema(_MaAtrRsi, _Wilders_Period) * _qqe
[_Wilders_Period, _RSI, _RsiMa, _AtrRsi, _dar]
[Wilders_Period, Rsi,RsiMa,AtrRsi,dar] = GetQQEDefaultValue(src, RSI_Period, SF, QQE)
GetFastAtrRsiTL(_dar, _RsiMa)=>
longband = 0.0
shortband = 0.0
trend = 0
DeltaFastAtrRsi = _dar
RSIndex = _RsiMa
newshortband = RSIndex + DeltaFastAtrRsi
newlongband = RSIndex - DeltaFastAtrRsi
longband := RSIndex[1] > longband[1] and RSIndex > longband[1] ? math.max(longband[1], newlongband) : newlongband
shortband := RSIndex[1] < shortband[1] and RSIndex < shortband[1] ? math.min(shortband[1], newshortband) : newshortband
cross_1 = ta.cross(longband[1], RSIndex)
trend := ta.cross(RSIndex, shortband[1]) ? 1 : cross_1 ? -1 : nz(trend[1], 1)
FastAtrRsiTL = trend == 1 ? longband : shortband
FastAtrRsiTL = GetFastAtrRsiTL(dar, RsiMa)
length = input.int(50, minval=1, title="Bollinger Length")
mult = input.float(0.35, minval=0.001, maxval=5, step=0.1, title="BB Multiplier")
basis = ta.sma(FastAtrRsiTL - 50, length)
dev = mult * ta.stdev(FastAtrRsiTL - 50, length)
upper = basis + dev
lower = basis - dev
Zero = hline(0, color=color.white, linestyle=hline.style_dotted, linewidth=1)
////////////////////////////////////////////////////////////////
RSI_Period2 = input(6, title='RSI Length')
SF2 = input(5, title='RSI Smoothing')
QQE2 = input(1.61, title='Fast QQE2 Factor')
ThresHold2 = input(3, title="Threshold")
src2 = input(close, title="RSI Source")
[Wilders_Period2, Rsi2,RsiMa2,AtrRsi2,dar2] = GetQQEDefaultValue(src2, RSI_Period2, SF2, QQE2)
FastAtrRsi2TL = GetFastAtrRsiTL(dar2, RsiMa2)
Greenbar1 = RsiMa2 - 50 > ThresHold2
Greenbar2 = RsiMa - 50 > upper
Redbar1 = RsiMa2 - 50 < 0 - ThresHold2
Redbar2 = RsiMa - 50 < lower
isLongTrend = Greenbar1 and Greenbar2 == 1
isShortTrend = Redbar1 and Redbar2 == 1
plot(isFillBackGround == false? FastAtrRsi2TL - 50:na , title='QQE Line', color=color.white, transp=0, linewidth=2)
plot(isFillBackGround == false ? RsiMa2 - 50 :na , title="QQE Area", style=plot.style_area, color= isLongTrend ? QQELongColor : isShortTrend ? QQEShortColor : QQEWeakColor)
isLongSignal = FastAtrRsi2TL - 50 >=0 and ta.crossunder(RsiMa2 - 50,FastAtrRsi2TL - 50) and isFillBackGround == false
isShortSignal = FastAtrRsi2TL - 50 <0 and ta.crossover(RsiMa2 - 50,FastAtrRsi2TL - 50) and isFillBackGround == false
감사합니다!
다음글
이전글