커뮤니티
파라볼릭 박스

2024-07-18 09:27:56
947
글번호 181609
첨부 이미지
그림1

Input : af(0.02), maxAF(0.2);
var : T(0),B(0),S(0),tx(0),HH(0),LL(0),box(0),B1(0),S1(0),H1(0),L1(0),TL(0);
var1 = CSar(af,maxAF);
if CrossUp(C,var1) Then
{
T = 1;
B = var1;
B1 = B[1];
HH = H;
H1 = HH[1];
if abs(S-LL) < 0.9 Then
Text_Delete(tx);
tx = Text_New(sDate,sTime,HH,NumToStr(abs(HH-B),2));
Text_SetColor(tx,Red);
Text_SetSize(tx,25);
Text_SetStyle(tx,1,1);
Text_SetBold(tx,1);
box = Box_New(sDate,sTime,B,NextBarSdate,NextBarStime,HH);
Condition1 = False;
}
if CrossDown(C,var1) Then
{
T = -1;
S = var1;
S1 = S[1];
LL = L;
L1 = LL[1];
if abs(B-HH) < 0.9 Then
Text_Delete(tx);
tx = Text_New(sDate,sTime,LL,NumToStr(abs(LL-S),2));
Text_SetColor(tx,Blue);
Text_SetSize(tx,25);
Text_SetStyle(tx,1,0);
Text_SetBold(tx,1);
box = Box_New(sDate,sTime,S,NextBarSdate,NextBarStime,LL);
Condition1 = False;
}
Else
{
if T == 1 Then
{
if H > HH Then
HH = H;
Text_SetString(tx,NumToStr(abs(HH-B),2));
Text_SetLocation(tx,sDate,sTime,HH);
Box_SetEnd(box,NextBarSdate,NextBarStime,hh);
if HH < B+0.6 Then
{
Box_SetColor(box,Orange);
Box_SetFill(box,true,90);
}
Else if HH >= B+0.6 and HH < B+0.8 Then
{
Box_SetColor(box,Gray);
Box_SetFill(box,true,80);
}
Else if HH >= B+0.8 and HH < B+1.3 Then
{
Box_SetColor(box,Magenta);
Box_SetFill(box,true,60);
}
Else if HH >= B+1.3 and HH < B+1.9 Then
{
Box_SetColor(box,Gray);
Box_SetFill(box,true,60);
}
Else
{
Box_SetColor(box,Pink);
Box_SetFill(box,true,90);
}
if B1 > 0 and B > B1 and H > H1 and Condition1 == False Then
{
Condition1 = true;
TL_Delete(TL);
TL =TL_New(sDate,sTime,0,sDate,sTime,999);
TL_SetColor(TL,Lime);
TL_SetSize(TL,2);
}
}
if T == -1 Then
{
if L < LL Then
LL = L;
Text_SetString(tx,NumToStr(abs(LL-S),2));
Text_SetLocation(tx,sDate,sTime,LL);
Box_SetEnd(box,NextBarSdate,NextBarStime,LL);
if LL > S-0.6 Then
{
Box_SetColor(box,Cyan);
Box_SetFill(box,true,150);
}
Else if LL <= S-0.6 and ll > S-0.9 Then
{
Box_SetColor(box,Yellow);
Box_SetFill(box,true,150);
}
Else if LL <= S-0.9 and ll > S-1.3 Then
{
Box_SetColor(box,Lime);
Box_SetFill(box,true,120);
}
Else if LL <= S-1.3 and ll > S-1.6 Then
{
Box_SetColor(box,Cyan);
Box_SetFill(box,true,90);
}
Else if LL <= S-1.6 and ll > S-1.9 Then
{
Box_SetColor(box,Blue);
Box_SetFill(box,true,30);
}
Else
{
Box_SetColor(box,Yellow);
Box_SetFill(box,true,120);
}
if S1 > 0 and S < S1 and L < L1 and Condition1 == False Then
{
Condition1 = true;
TL_Delete(TL);
TL =TL_New(sDate,sTime,0,sDate,sTime,999);
TL_SetColor(TL,Gold);
TL_SetSize(TL,3);
}
}
}
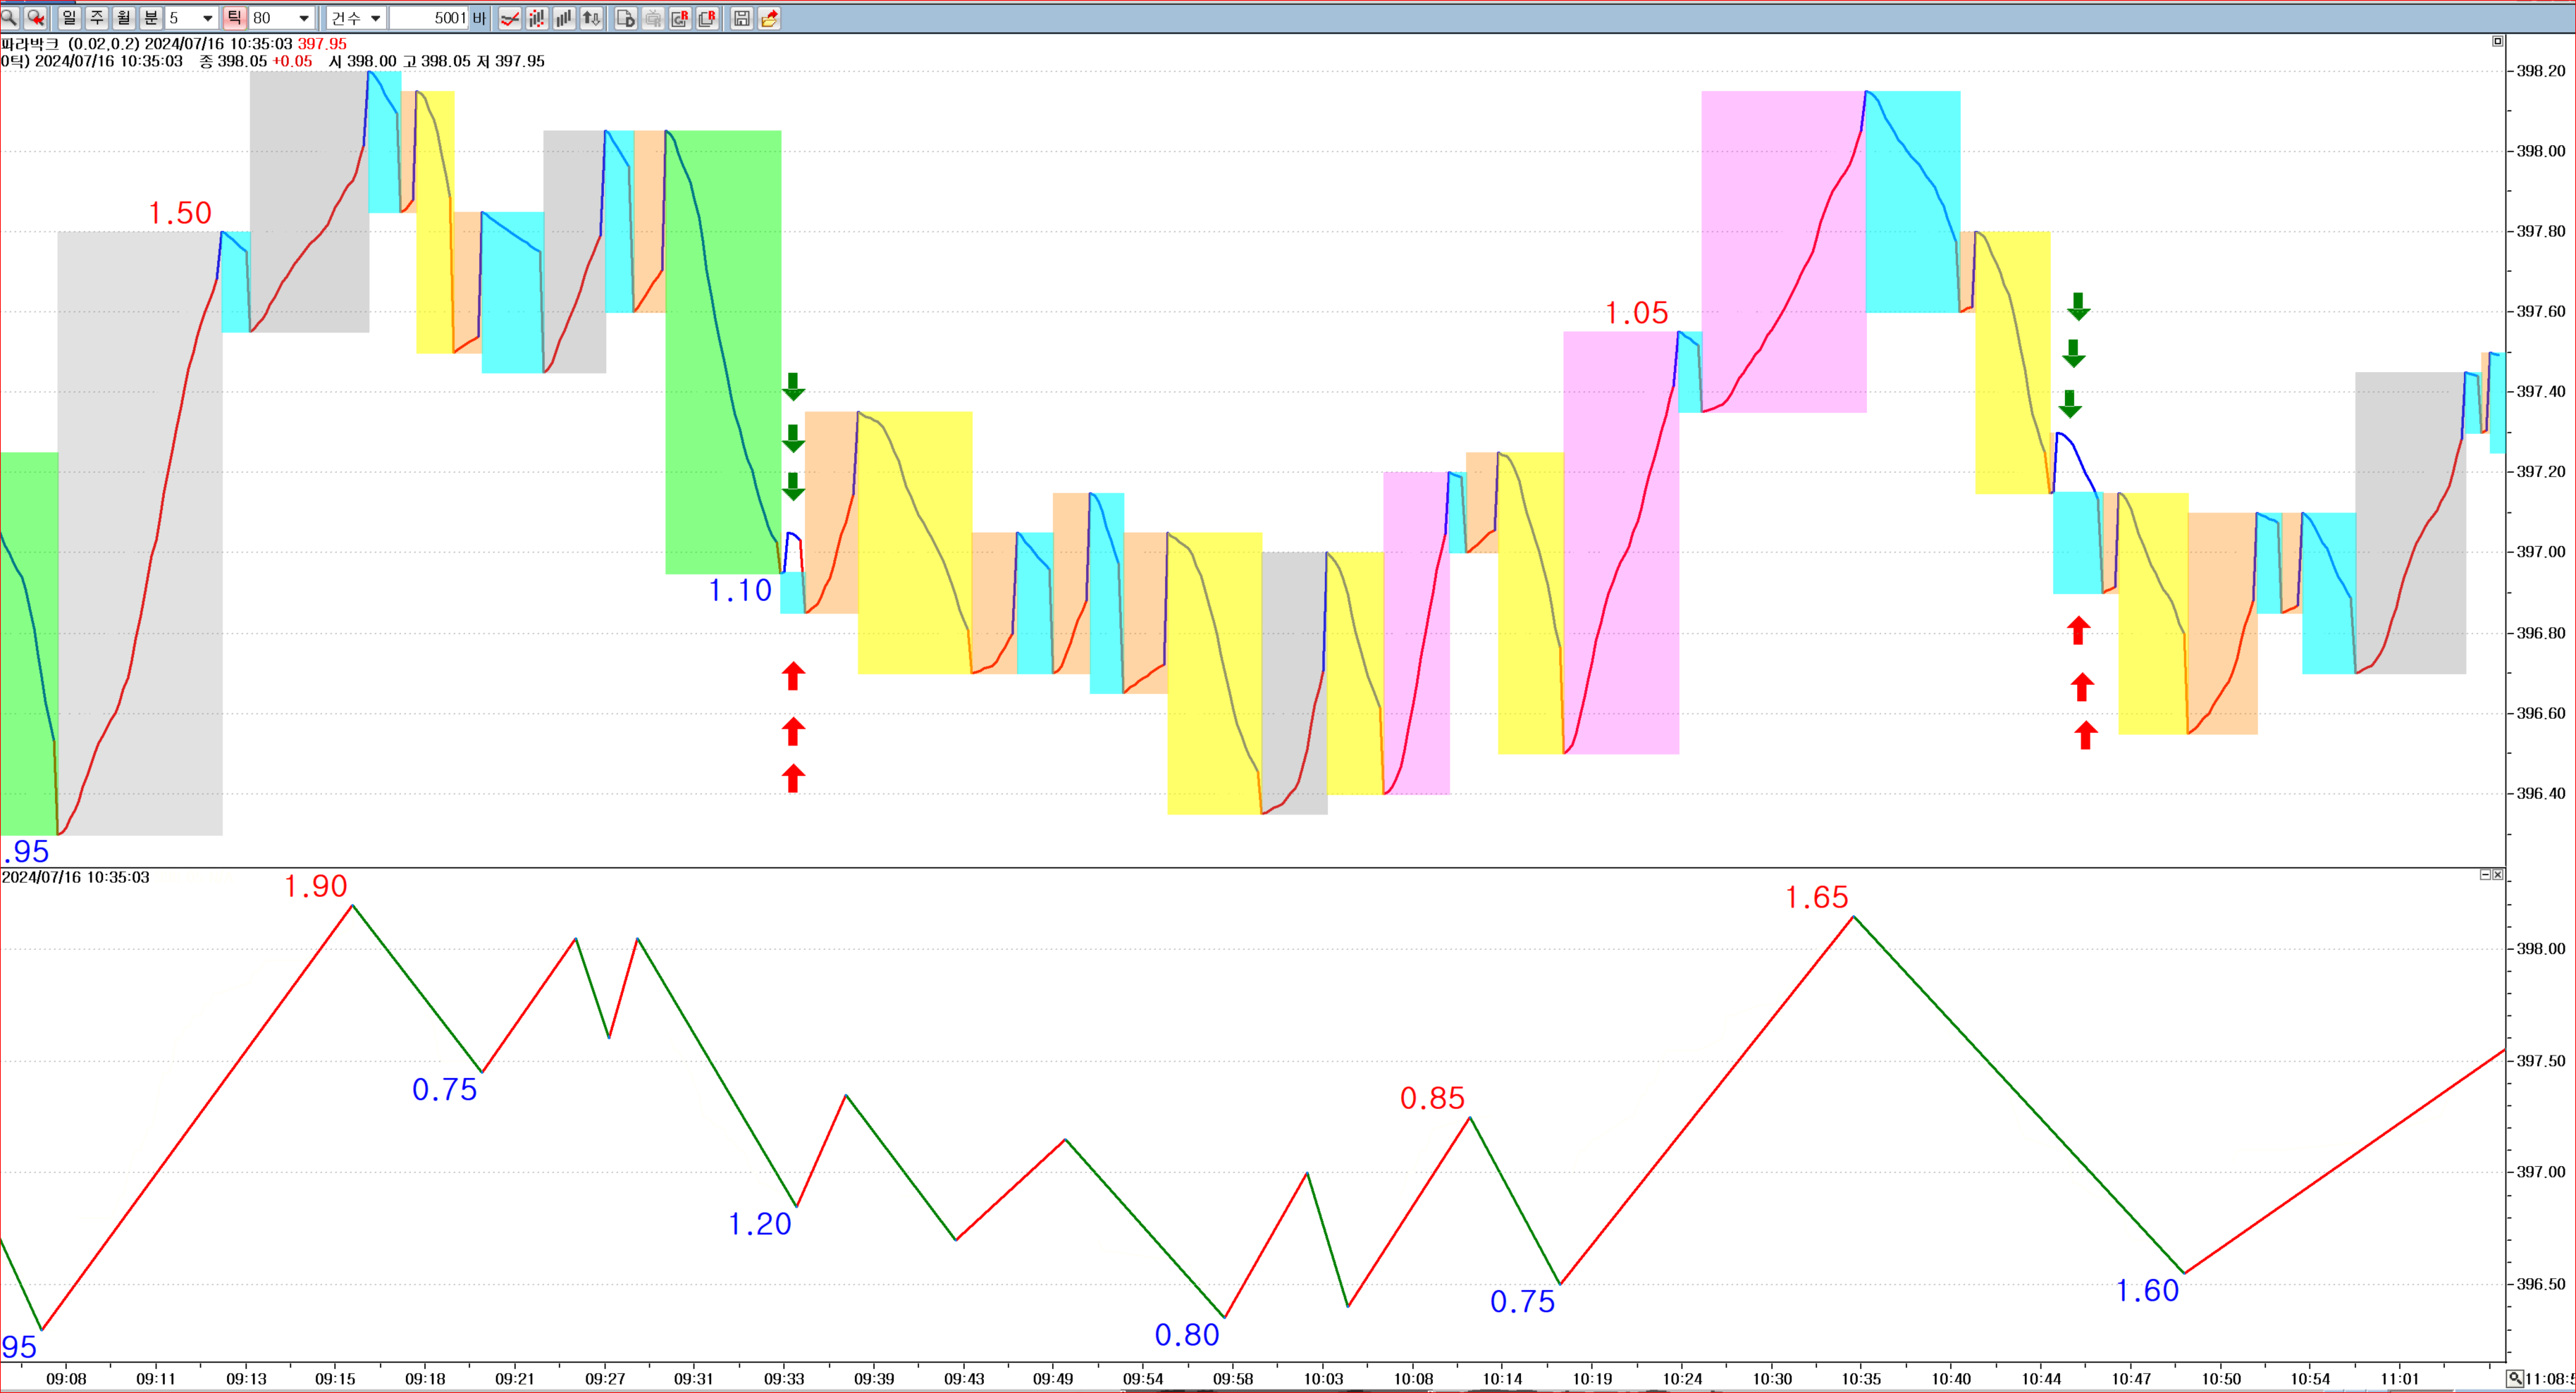
a. 선물 80틱 차트에서, 일부 박스에서 그림의 화살표 부분처럼 일부분이 표시가 안됩니다.
하락시는 반등폭이 작을 때 주로 박스 상단부가 잘리고(박스 상단 불일치),
상승시는 조정폭이 작을 때 박스 하단부가 잘립니다. 수정 부탁드립니다.
b. plot을 안쓰고는 파라볼릭 선을 시스템에 표시할 수는 없나요?
알려주신 다른 여러 시스템 수식에서, plot 없이도 그런 선을 표시하고 있어 여쭤봅니다.
c. 하락박스의 크기가 0.9에 도달하면 바로 박스 하단에 네모 표시.
상승박스의 크기가 0.9에 도달하면 박스 상단에 네모 표시.
하락박스의 크기가 0.9에 도달하면 매수, 다음봉에 매수청산.
상승박스의 크기가 0.9에 도달하면 매도, 다음봉에 매도청산.
늘 성의있는 답변 감사드립니다.
- 1. 20240718_084417.png (0.44 MB)
답변 1

예스스탁 예스스탁 답변
2024-07-18 15:40:49
안녕하세요
예스스탁입니다.
1
현재 상승시 하단과 하락시 상산은 첫봉값을 고정으로 사용합니다.
상승시 최저, 하락구간 최고로 수정해 드립니다.
Input : af(0.02), maxAF(0.2);
var : T(0),B(0),S(0),tx(0),HH(0),LL(0),box(0),B1(0),S1(0),H1(0),L1(0),TL(0);
var : Z(0),dd(0),tt(0);
var1 = CSar(af,maxAF);
if CrossUp(C,var1) Then
{
T = 1;
B = var1;
B1 = B[1];
HH = H;
H1 = HH[1];
dd = sDate;
tt = sTime;
if abs(S-LL) < 0.9 Then
Text_Delete(tx);
tx = Text_New(sDate,sTime,HH,NumToStr(abs(HH-B),2));
Text_SetColor(tx,Red);
Text_SetSize(tx,25);
Text_SetStyle(tx,1,1);
Text_SetBold(tx,1);
box = Box_New(sDate,sTime,B,NextBarSdate,NextBarStime,HH);
Condition1 = False;
}
if CrossDown(C,var1) Then
{
T = -1;
S = var1;
S1 = S[1];
LL = L;
L1 = LL[1];
dd = sDate;
tt = sTime;
if abs(B-HH) < 0.9 Then
Text_Delete(tx);
tx = Text_New(sDate,sTime,LL,NumToStr(abs(LL-S),2));
Text_SetColor(tx,Blue);
Text_SetSize(tx,25);
Text_SetStyle(tx,1,0);
Text_SetBold(tx,1);
box = Box_New(sDate,sTime,S,NextBarSdate,NextBarStime,LL);
Condition1 = False;
}
if T == 1 Then
{
if var1 < S Then
{
S = var1;
box_SetBegin(box,dd,tt,S);
}
if H > HH Then
HH = H;
Text_SetString(tx,NumToStr(abs(HH-B),2));
Text_SetLocation(tx,sDate,sTime,HH);
Box_SetEnd(box,NextBarSdate,NextBarStime,hh);
if HH < B+0.6 Then
{
Box_SetColor(box,Orange);
Box_SetFill(box,true,90);
}
Else if HH >= B+0.6 and HH < B+0.8 Then
{
Box_SetColor(box,Gray);
Box_SetFill(box,true,80);
}
Else if HH >= B+0.8 and HH < B+1.3 Then
{
Box_SetColor(box,Magenta);
Box_SetFill(box,true,60);
}
Else if HH >= B+1.3 and HH < B+1.9 Then
{
Box_SetColor(box,Gray);
Box_SetFill(box,true,60);
}
Else
{
Box_SetColor(box,Pink);
Box_SetFill(box,true,90);
}
if B1 > 0 and B > B1 and H > H1 and Condition1 == False Then
{
Condition1 = true;
TL_Delete(TL);
TL =TL_New(sDate,sTime,0,sDate,sTime,999);
TL_SetColor(TL,Lime);
TL_SetSize(TL,2);
}
}
if T == -1 Then
{
if var1 > S Then
{
S = var1;
box_SetBegin(box,dd,tt,S);
}
if L < LL Then
LL = L;
Text_SetString(tx,NumToStr(abs(LL-S),2));
Text_SetLocation(tx,sDate,sTime,LL);
Box_SetEnd(box,NextBarSdate,NextBarStime,LL);
if LL > S-0.6 Then
{
Box_SetColor(box,Cyan);
Box_SetFill(box,true,150);
}
Else if LL <= S-0.6 and ll > S-0.9 Then
{
Box_SetColor(box,Yellow);
Box_SetFill(box,true,150);
}
Else if LL <= S-0.9 and ll > S-1.3 Then
{
Box_SetColor(box,Lime);
Box_SetFill(box,true,120);
}
Else if LL <= S-1.3 and ll > S-1.6 Then
{
Box_SetColor(box,Cyan);
Box_SetFill(box,true,90);
}
Else if LL <= S-1.6 and ll > S-1.9 Then
{
Box_SetColor(box,Blue);
Box_SetFill(box,true,30);
}
Else
{
Box_SetColor(box,Yellow);
Box_SetFill(box,true,120);
}
if S1 > 0 and S < S1 and L < L1 and Condition1 == False Then
{
Condition1 = true;
TL_Delete(TL);
TL =TL_New(sDate,sTime,0,sDate,sTime,999);
TL_SetColor(TL,Gold);
TL_SetSize(TL,3);
}
}
2
시스템식에서는 추세선, 박스, 텍스트로만 출력이 가능합니다.
plot은 지표식과 검색식에서만 사용이 가능한 출력함수입니다.
다른종류의 수식에서 사용하면 검증시 사용할 수 없다고 오류가 발생합니다.
시스템식에서 수평선등은 추세선으로 출력이 된것입니다.
3
Input : af(0.02), maxAF(0.2);
var : T(0),B(0),S(0),tx(0),HH(0),LL(0),box(0),B1(0),S1(0),H1(0),L1(0),TL(0);
var : Z(0),dd(0),tt(0),xx(0);
var1 = CSar(af,maxAF);
if CrossUp(C,var1) Then
{
T = 1;
B = var1;
B1 = B[1];
HH = H;
H1 = HH[1];
dd = sDate;
tt = sTime;
if abs(S-LL) < 0.9 Then
Text_Delete(tx);
tx = Text_New(sDate,sTime,HH,NumToStr(abs(HH-B),2));
Text_SetColor(tx,Red);
Text_SetSize(tx,25);
Text_SetStyle(tx,1,1);
Text_SetBold(tx,1);
box = Box_New(sDate,sTime,B,NextBarSdate,NextBarStime,HH);
Condition1 = False;
Condition2 = False;
}
if CrossDown(C,var1) Then
{
T = -1;
S = var1;
S1 = S[1];
LL = L;
L1 = LL[1];
dd = sDate;
tt = sTime;
if abs(B-HH) < 0.9 Then
Text_Delete(tx);
tx = Text_New(sDate,sTime,LL,NumToStr(abs(LL-S),2));
Text_SetColor(tx,Blue);
Text_SetSize(tx,25);
Text_SetStyle(tx,1,0);
Text_SetBold(tx,1);
box = Box_New(sDate,sTime,S,NextBarSdate,NextBarStime,LL);
Condition3 = False;
Condition4 = False;
}
if T == 1 Then
{
if var1 < B Then
{
B = var1;
box_SetBegin(box,dd,tt,S);
}
if H > HH Then
HH = H;
Text_SetString(tx,NumToStr(abs(HH-B),2));
Text_SetLocation(tx,sDate,sTime,HH);
Box_SetEnd(box,NextBarSdate,NextBarStime,hh);
if HH < B+0.6 Then
{
Box_SetColor(box,Orange);
Box_SetFill(box,true,90);
}
Else if HH >= B+0.6 and HH < B+0.8 Then
{
Box_SetColor(box,Gray);
Box_SetFill(box,true,80);
}
Else if HH >= B+0.8 and HH < B+1.3 Then
{
Box_SetColor(box,Magenta);
Box_SetFill(box,true,60);
}
Else if HH >= B+1.3 and HH < B+1.9 Then
{
Box_SetColor(box,Gray);
Box_SetFill(box,true,60);
}
Else
{
Box_SetColor(box,Pink);
Box_SetFill(box,true,90);
}
if B1 > 0 and B > B1 and H > H1 and Condition1 == False Then
{
Condition1 = true;
TL_Delete(TL);
TL =TL_New(sDate,sTime,0,sDate,sTime,999);
TL_SetColor(TL,Lime);
TL_SetSize(TL,2);
}
if Condition2 == False and HH >= B+0.9 Then
{
Condition2 = true;
xx = Text_New(sdate,sTime,HH,"■");
Text_SetStyle(tx,2,2);
Sell("s");
}
}
if T == -1 Then
{
if var1 > S Then
{
S = var1;
box_SetBegin(box,dd,tt,S);
}
if L < LL Then
LL = L;
Text_SetString(tx,NumToStr(abs(LL-S),2));
Text_SetLocation(tx,sDate,sTime,LL);
Box_SetEnd(box,NextBarSdate,NextBarStime,LL);
if LL > S-0.6 Then
{
Box_SetColor(box,Cyan);
Box_SetFill(box,true,150);
}
Else if LL <= S-0.6 and ll > S-0.9 Then
{
Box_SetColor(box,Yellow);
Box_SetFill(box,true,150);
}
Else if LL <= S-0.9 and ll > S-1.3 Then
{
Box_SetColor(box,Lime);
Box_SetFill(box,true,120);
}
Else if LL <= S-1.3 and ll > S-1.6 Then
{
Box_SetColor(box,Cyan);
Box_SetFill(box,true,90);
}
Else if LL <= S-1.6 and ll > S-1.9 Then
{
Box_SetColor(box,Blue);
Box_SetFill(box,true,30);
}
Else
{
Box_SetColor(box,Yellow);
Box_SetFill(box,true,120);
}
if S1 > 0 and S < S1 and L < L1 and Condition3 == False Then
{
Condition3 = true;
TL_Delete(TL);
TL =TL_New(sDate,sTime,0,sDate,sTime,999);
TL_SetColor(TL,Gold);
TL_SetSize(TL,3);
}
if Condition4 == False and LL <= S-0.9 Then
{
Condition4 = true;
xx = Text_New(sdate,sTime,HH,"■");
Text_SetStyle(tx,2,2);
Buy("b");
}
}
if MarketPosition == -1 and BarsSinceEntry == 1 Then
ExitShort("sx");
if MarketPosition == 1 and BarsSinceEntry == 1 Then
Exitlong("bx");
즐거운 하루되세요
> 고성 님이 쓴 글입니다.
> 제목 : 파라볼릭 박스
> Input : af(0.02), maxAF(0.2);
var : T(0),B(0),S(0),tx(0),HH(0),LL(0),box(0),B1(0),S1(0),H1(0),L1(0),TL(0);
var1 = CSar(af,maxAF);
if CrossUp(C,var1) Then
{
T = 1;
B = var1;
B1 = B[1];
HH = H;
H1 = HH[1];
if abs(S-LL) < 0.9 Then
Text_Delete(tx);
tx = Text_New(sDate,sTime,HH,NumToStr(abs(HH-B),2));
Text_SetColor(tx,Red);
Text_SetSize(tx,25);
Text_SetStyle(tx,1,1);
Text_SetBold(tx,1);
box = Box_New(sDate,sTime,B,NextBarSdate,NextBarStime,HH);
Condition1 = False;
}
if CrossDown(C,var1) Then
{
T = -1;
S = var1;
S1 = S[1];
LL = L;
L1 = LL[1];
if abs(B-HH) < 0.9 Then
Text_Delete(tx);
tx = Text_New(sDate,sTime,LL,NumToStr(abs(LL-S),2));
Text_SetColor(tx,Blue);
Text_SetSize(tx,25);
Text_SetStyle(tx,1,0);
Text_SetBold(tx,1);
box = Box_New(sDate,sTime,S,NextBarSdate,NextBarStime,LL);
Condition1 = False;
}
Else
{
if T == 1 Then
{
if H > HH Then
HH = H;
Text_SetString(tx,NumToStr(abs(HH-B),2));
Text_SetLocation(tx,sDate,sTime,HH);
Box_SetEnd(box,NextBarSdate,NextBarStime,hh);
if HH < B+0.6 Then
{
Box_SetColor(box,Orange);
Box_SetFill(box,true,90);
}
Else if HH >= B+0.6 and HH < B+0.8 Then
{
Box_SetColor(box,Gray);
Box_SetFill(box,true,80);
}
Else if HH >= B+0.8 and HH < B+1.3 Then
{
Box_SetColor(box,Magenta);
Box_SetFill(box,true,60);
}
Else if HH >= B+1.3 and HH < B+1.9 Then
{
Box_SetColor(box,Gray);
Box_SetFill(box,true,60);
}
Else
{
Box_SetColor(box,Pink);
Box_SetFill(box,true,90);
}
if B1 > 0 and B > B1 and H > H1 and Condition1 == False Then
{
Condition1 = true;
TL_Delete(TL);
TL =TL_New(sDate,sTime,0,sDate,sTime,999);
TL_SetColor(TL,Lime);
TL_SetSize(TL,2);
}
}
if T == -1 Then
{
if L < LL Then
LL = L;
Text_SetString(tx,NumToStr(abs(LL-S),2));
Text_SetLocation(tx,sDate,sTime,LL);
Box_SetEnd(box,NextBarSdate,NextBarStime,LL);
if LL > S-0.6 Then
{
Box_SetColor(box,Cyan);
Box_SetFill(box,true,150);
}
Else if LL <= S-0.6 and ll > S-0.9 Then
{
Box_SetColor(box,Yellow);
Box_SetFill(box,true,150);
}
Else if LL <= S-0.9 and ll > S-1.3 Then
{
Box_SetColor(box,Lime);
Box_SetFill(box,true,120);
}
Else if LL <= S-1.3 and ll > S-1.6 Then
{
Box_SetColor(box,Cyan);
Box_SetFill(box,true,90);
}
Else if LL <= S-1.6 and ll > S-1.9 Then
{
Box_SetColor(box,Blue);
Box_SetFill(box,true,30);
}
Else
{
Box_SetColor(box,Yellow);
Box_SetFill(box,true,120);
}
if S1 > 0 and S < S1 and L < L1 and Condition1 == False Then
{
Condition1 = true;
TL_Delete(TL);
TL =TL_New(sDate,sTime,0,sDate,sTime,999);
TL_SetColor(TL,Gold);
TL_SetSize(TL,3);
}
}
}
a. 선물 80틱 차트에서, 일부 박스에서 그림의 화살표 부분처럼 일부분이 표시가 안됩니다.
하락시는 반등폭이 작을 때 주로 박스 상단부가 잘리고(박스 상단 불일치),
상승시는 조정폭이 작을 때 박스 하단부가 잘립니다. 수정 부탁드립니다.
b. plot을 안쓰고는 파라볼릭 선을 시스템에 표시할 수는 없나요?
알려주신 다른 여러 시스템 수식에서, plot 없이도 그런 선을 표시하고 있어 여쭤봅니다.
c. 하락박스의 크기가 0.9에 도달하면 바로 박스 하단에 네모 표시.
상승박스의 크기가 0.9에 도달하면 박스 상단에 네모 표시.
하락박스의 크기가 0.9에 도달하면 매수, 다음봉에 매수청산.
상승박스의 크기가 0.9에 도달하면 매도, 다음봉에 매도청산.
늘 성의있는 답변 감사드립니다.
다음글
이전글