커뮤니티
지표와 PaintBar 조건이 상이하게 나옵니다.

2024-03-14 13:24:50
965
글번호 177478
첨부 이미지
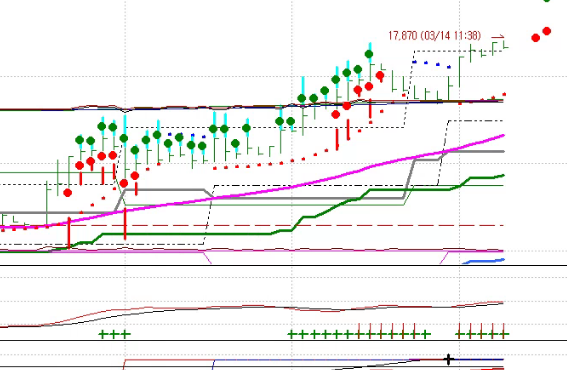
그림1

수고하십니다. 하기조건에서 지표와 페인트바 조건이 상이하게 나옵니다.
확인 요청드립니다.
######## PaintBar ##########
input : low_period(30),Stdev_period(50);
var : W(1);//1이면 가중이평, 0이면 단순이평
var : source(0),DM(0);
var : FZ1(0),FAVG1(0),FSTDEV1(0),FZ1Limit(0);
var : FZ2(0),FAVG2(0),FSTDEV2(0),FZ2Limit(0);
var : F_Con(False),FO(0),FC(0),tx(0),tx1(0),test(0);
source = (o+h+l+c)/4;
FZ1 = (lowest(source,low_period) - source)/lowest(source,low_period);
FAVG1 = iff(W==0,ma(FZ1,Stdev_period),wma(FZ1,Stdev_period));
FSTDEV1 = std(FZ1,Stdev_period);
FZ1Limit = FAVG1-FSTDEV1;
FZ2 = iff(W==0,ma(source, low_period),wma(source, low_period));
FAVG2 = iff(W==0,ma(FZ2,Stdev_period),wma(FZ2,Stdev_period));
FSTDEV2 = std(FZ2, Stdev_period);
FZ2Limit = FAVG2+FSTDEV2;
// Fearzone
F_Con = FZ1 < FZ1Limit and FZ2 > FZ2Limit;
if F_Con Then test = 1;
Else test = 0;
FO = iff(F_Con == true, low-TrueRange,Nan);
FC = iff(F_Con == true, low-2*TrueRange,Nan);
PlotPaintBar(FO,FC,"FearZone Candlesticks",Red);
tx1 = text_new(sDate,sTime,L,NumToStr(test,0));
Text_SetStyle(tx,2,0);
Text_SetColor(tx,Red);
if F_Con == true Then
{
tx = text_new(sDate,sTime,L,"●");
Text_SetStyle(tx,2,0);
Text_SetColor(tx,Red);
}
######## 지표 ##########
input : low_period(30),Stdev_period(50);
var : W(1);//1이면 가중이평, 0이면 단순이평
var : source(0),DM(0);
var : FZ1(0),FAVG1(0),FSTDEV1(0),FZ1Limit(0);
var : FZ2(0),FAVG2(0),FSTDEV2(0),FZ2Limit(0);
var : F_Con(False),FO(0),FC(0),tx(0),tx1(0),test(0);
source = (o+h+l+c)/4;
FZ1 = (lowest(source,low_period) - source)/lowest(source,low_period);
FAVG1 = iff(W==0,ma(FZ1,Stdev_period),wma(FZ1,Stdev_period));
FSTDEV1 = std(FZ1,Stdev_period);
FZ1Limit = FAVG1-FSTDEV1;
FZ2 = iff(W==0,ma(source, low_period),wma(source, low_period));
FAVG2 = iff(W==0,ma(FZ2,Stdev_period),wma(FZ2,Stdev_period));
FSTDEV2 = std(FZ2, Stdev_period);
FZ2Limit = FAVG2+FSTDEV2;
// Fearzone
F_Con = FZ1 < FZ1Limit and FZ2 > FZ2Limit;
FO = iff(F_Con == true, low-TrueRange,Nan);
FC = iff(F_Con == true, low-2*TrueRange,Nan);
F_Con = FZ1 < FZ1Limit and FZ2 > FZ2Limit;
if F_Con Then test = 1;
Else test = 0;
plot1(FZ1,"FZ1");
plot2(FZ1Limit,"FZ1Limit");
plot3(FZ2,"FZ2");
plot4(FZ2Limit,"FZ2Limit");
plot5(FO,"FO");
plot6(FC,"FC");
plot7(TrueRange,"TrueRange");
plot8(test,"test");
**********************************************************
test 값이 상이하게 나옵니다.
F_Con 값이 True 가 PaintBar 에서 간헐적인데 지표에서는 연속적으로 나옵니다.
수식으로는 연속이 맞는데 PaintBar 에서 상이한것 같습니다.
PaintBar 조건처럼 나오게 할수 있는 방법을 찾고 있습니다.
가능한지요?
- 1. 178297_캡처.PNG (0.13 MB)
답변 1

예스스탁 예스스탁 답변
2024-03-14 13:40:26
안녕하세요
예스스탁입니다.
첨부된 그림과 같이 32/64에서 모두 동일조건시에 출력되고 있습니다.
즐거운 하루되세요
> 큰상 님이 쓴 글입니다.
> 제목 : 지표와 PaintBar 조건이 상이하게 나옵니다.
> 수고하십니다. 하기조건에서 지표와 페인트바 조건이 상이하게 나옵니다.
확인 요청드립니다.
######## PaintBar ##########
input : low_period(30),Stdev_period(50);
var : W(1);//1이면 가중이평, 0이면 단순이평
var : source(0),DM(0);
var : FZ1(0),FAVG1(0),FSTDEV1(0),FZ1Limit(0);
var : FZ2(0),FAVG2(0),FSTDEV2(0),FZ2Limit(0);
var : F_Con(False),FO(0),FC(0),tx(0),tx1(0),test(0);
source = (o+h+l+c)/4;
FZ1 = (lowest(source,low_period) - source)/lowest(source,low_period);
FAVG1 = iff(W==0,ma(FZ1,Stdev_period),wma(FZ1,Stdev_period));
FSTDEV1 = std(FZ1,Stdev_period);
FZ1Limit = FAVG1-FSTDEV1;
FZ2 = iff(W==0,ma(source, low_period),wma(source, low_period));
FAVG2 = iff(W==0,ma(FZ2,Stdev_period),wma(FZ2,Stdev_period));
FSTDEV2 = std(FZ2, Stdev_period);
FZ2Limit = FAVG2+FSTDEV2;
// Fearzone
F_Con = FZ1 < FZ1Limit and FZ2 > FZ2Limit;
if F_Con Then test = 1;
Else test = 0;
FO = iff(F_Con == true, low-TrueRange,Nan);
FC = iff(F_Con == true, low-2*TrueRange,Nan);
PlotPaintBar(FO,FC,"FearZone Candlesticks",Red);
tx1 = text_new(sDate,sTime,L,NumToStr(test,0));
Text_SetStyle(tx,2,0);
Text_SetColor(tx,Red);
if F_Con == true Then
{
tx = text_new(sDate,sTime,L,"●");
Text_SetStyle(tx,2,0);
Text_SetColor(tx,Red);
}
######## 지표 ##########
input : low_period(30),Stdev_period(50);
var : W(1);//1이면 가중이평, 0이면 단순이평
var : source(0),DM(0);
var : FZ1(0),FAVG1(0),FSTDEV1(0),FZ1Limit(0);
var : FZ2(0),FAVG2(0),FSTDEV2(0),FZ2Limit(0);
var : F_Con(False),FO(0),FC(0),tx(0),tx1(0),test(0);
source = (o+h+l+c)/4;
FZ1 = (lowest(source,low_period) - source)/lowest(source,low_period);
FAVG1 = iff(W==0,ma(FZ1,Stdev_period),wma(FZ1,Stdev_period));
FSTDEV1 = std(FZ1,Stdev_period);
FZ1Limit = FAVG1-FSTDEV1;
FZ2 = iff(W==0,ma(source, low_period),wma(source, low_period));
FAVG2 = iff(W==0,ma(FZ2,Stdev_period),wma(FZ2,Stdev_period));
FSTDEV2 = std(FZ2, Stdev_period);
FZ2Limit = FAVG2+FSTDEV2;
// Fearzone
F_Con = FZ1 < FZ1Limit and FZ2 > FZ2Limit;
FO = iff(F_Con == true, low-TrueRange,Nan);
FC = iff(F_Con == true, low-2*TrueRange,Nan);
F_Con = FZ1 < FZ1Limit and FZ2 > FZ2Limit;
if F_Con Then test = 1;
Else test = 0;
plot1(FZ1,"FZ1");
plot2(FZ1Limit,"FZ1Limit");
plot3(FZ2,"FZ2");
plot4(FZ2Limit,"FZ2Limit");
plot5(FO,"FO");
plot6(FC,"FC");
plot7(TrueRange,"TrueRange");
plot8(test,"test");
**********************************************************
test 값이 상이하게 나옵니다.
F_Con 값이 True 가 PaintBar 에서 간헐적인데 지표에서는 연속적으로 나옵니다.
수식으로는 연속이 맞는데 PaintBar 에서 상이한것 같습니다.
PaintBar 조건처럼 나오게 할수 있는 방법을 찾고 있습니다.
가능한지요?
다음글
이전글