커뮤니티
수식수정 문의

2024-03-06 15:04:22
1112
글번호 177219
첨부 이미지
그림1

그림2

안녕하세요.
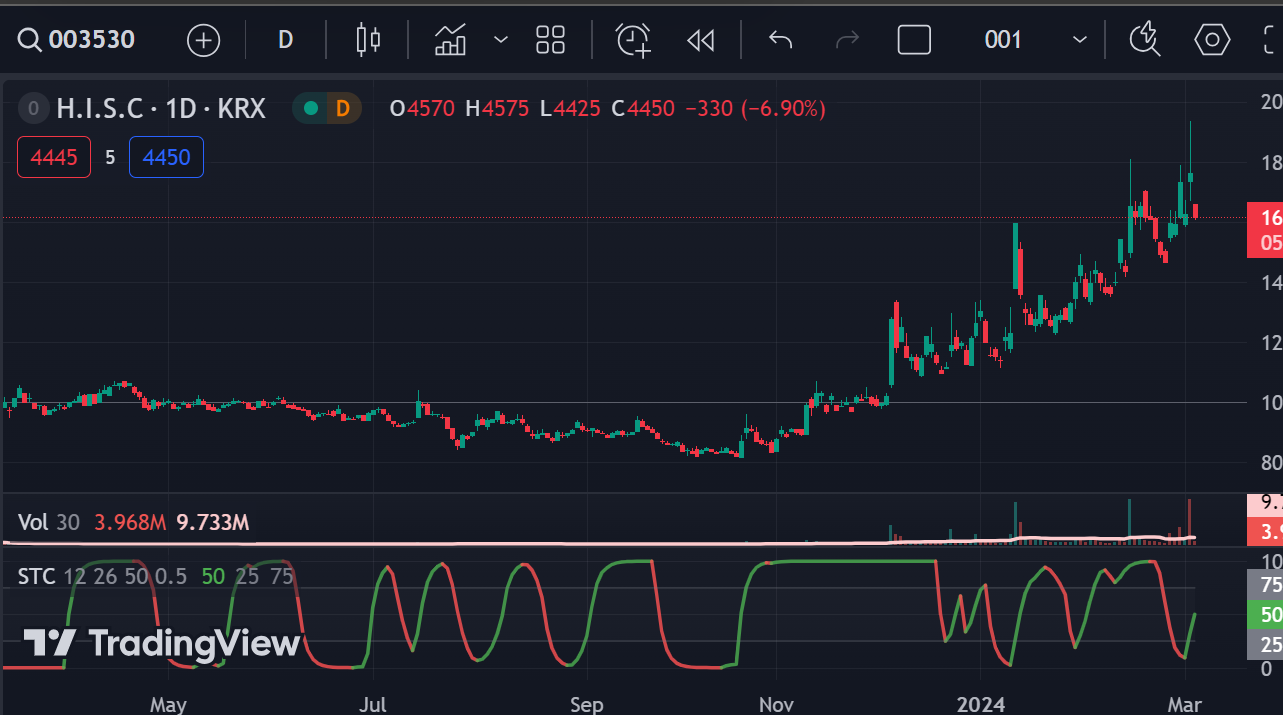
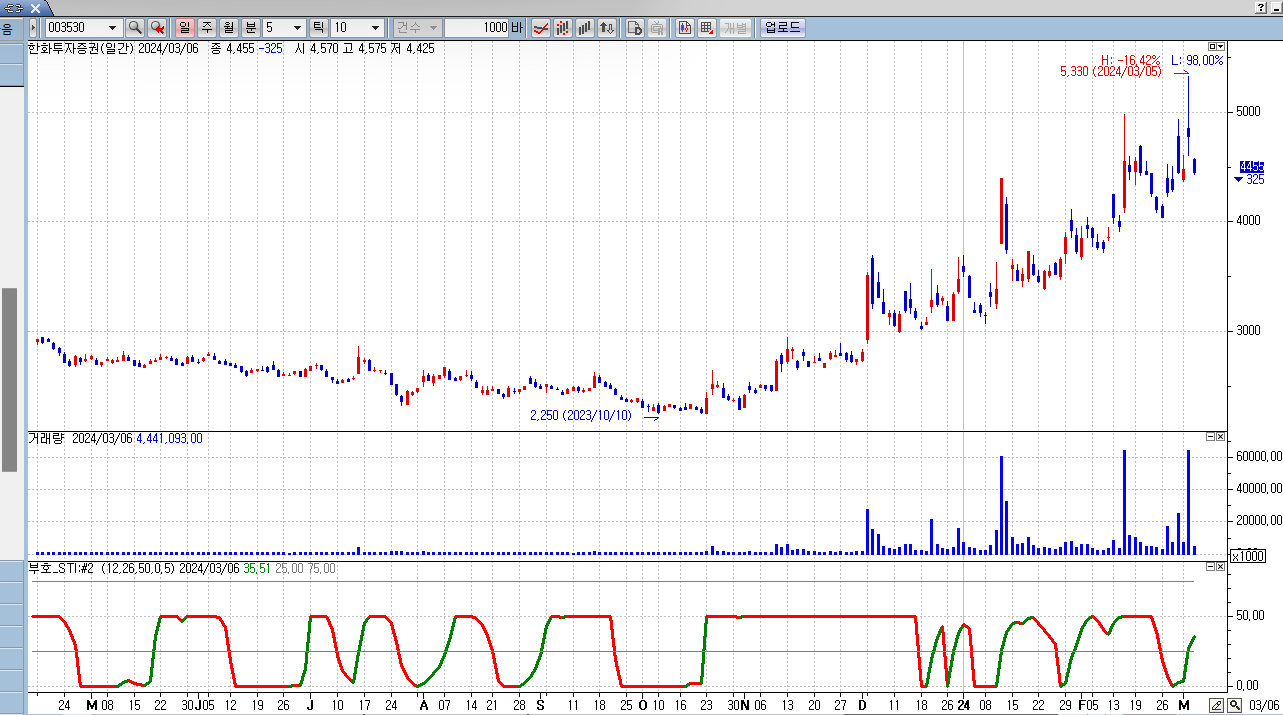
트레이딩뷰 지표인 STC INDICATOP를 아래와 같이 예스랭귀지로 변환하면
STC 본선의 모양은 거의 동일하게 구현이 되는데 첨부파일에서와 같이
선의 색상이 바뀌는 지점이 다르게 나타나는 경우가 있습니다.
특히 STC라인이 상단과 하단에 있을 때 초록색이 빨간색으로/
빨간색이 초록색으로 바뀌는 지점에서 그런 현상이 많이 나타나고 있습니다.
이 오류부분을 수정해 주시면 감사하겠습니다.
STC는 색상이 바뀌는 지점이 매매 타점이어서 중요합니다.
부탁드립니다.
input : length(20);
input : typeMA(0);#0:sma, 1: ema, 2:rma, 3:WMa, 4: vwma
input : smoothingLength(5);
var : src(0),mav(0),cnt(0),cciv(0),smoothingLine(0);
var : alpha(0);
src = (h+l+c)/3;
mav = ma(src, length);
cciv = (src - mav) / (0.015 *AvgDeviation(src,length));
if typeMA == 0 Then
smoothingLine = ma(cciv, smoothingLength);
else if typeMA == 1 Then
smoothingLine = ema(cciv, smoothingLength);
else if typeMA == 2 Then
{
alpha = 1/length;
smoothingLine = 0.0;
smoothingLine = iff(isnan(smoothingLine[1]) == true,ma(cciv, length), alpha * cciv + (1 - alpha) * smoothingLine[1]);
}
else if typeMA == 3 Then
smoothingLine = wma(cciv, smoothingLength);
Else
smoothingLine = ma(cciv * volume, smoothingLength) / ma(volume, smoothingLength);
plot1(cciv, "CCI",Blue);
plot2(smoothingLine, "Smoothing Line", Orange);
PlotBaseLine1(100, "Upper Band",Gray);
PlotBaseLine2(0, "Middle Band",Gray);
PlotBaseLine3(-100, "Lower Band",Gray);
============================================================
트레이딩뷰 소스코드
//@version=5
//[SHK] STC colored indicator
//https://www.tradingview.com/u/shayankm/
indicator(title='[SHK] Schaff Trend Cycle (STC)', shorttitle='STC', overlay=false)
EEEEEE = input(12, 'Length')
BBBB = input(26, 'FastLength')
BBBBB = input(50, 'SlowLength')
AAAA(BBB, BBBB, BBBBB) =>
fastMA = ta.ema(BBB, BBBB)
slowMA = ta.ema(BBB, BBBBB)
AAAA = fastMA - slowMA
AAAA
AAAAA(EEEEEE, BBBB, BBBBB) =>
AAA = input(0.5)
var CCCCC = 0.0
var DDD = 0.0
var DDDDDD = 0.0
var EEEEE = 0.0
BBBBBB = AAAA(close, BBBB, BBBBB)
CCC = ta.lowest(BBBBBB, EEEEEE)
CCCC = ta.highest(BBBBBB, EEEEEE) - CCC
CCCCC := CCCC > 0 ? (BBBBBB - CCC) / CCCC * 100 : nz(CCCCC[1])
DDD := na(DDD[1]) ? CCCCC : DDD[1] + AAA * (CCCCC - DDD[1])
DDDD = ta.lowest(DDD, EEEEEE)
DDDDD = ta.highest(DDD, EEEEEE) - DDDD
DDDDDD := DDDDD > 0 ? (DDD - DDDD) / DDDDD * 100 : nz(DDDDDD[1])
EEEEE := na(EEEEE[1]) ? DDDDDD : EEEEE[1] + AAA * (DDDDDD - EEEEE[1])
EEEEE
mAAAAA = AAAAA(EEEEEE, BBBB, BBBBB)
mColor = mAAAAA > mAAAAA[1] ? color.new(color.green, 20) : color.new(color.red, 20)
if mAAAAA[3] <= mAAAAA[2] and mAAAAA[2] > mAAAAA[1] and mAAAAA > 75
alert("Red", alert.freq_once_per_bar)
if mAAAAA[3] >= mAAAAA[2] and mAAAAA[2] < mAAAAA[1] and mAAAAA < 25
alert("Green", alert.freq_once_per_bar)
plot(mAAAAA, color=mColor, title='STC', linewidth=2)
ul = plot(25, color=color.new(color.gray, 70))
ll = plot(75, color=color.new(color.gray, 70))
fill(ul, ll, color=color.new(color.gray, 96))
- 1. 캡처_2024_03_06_10_20_52_546.png (0.12 MB)
- 2. 캡처_2024_03_06_10_19_41_601.png (0.05 MB)
답변 1

예스스탁 예스스탁 답변
2024-03-06 17:42:19
안녕하세요
예스스탁입니다.
올려주신 예스랭귀지 수식은 다른 수식입니다.
트레이딩뷰 수식을 변환해 드립니다.
input : EEEEEE(12),BBBB(26),BBBBB(50);
var : AAA(0);
var : BBBBBB(0);
var : CCC(0),CCCC(0),CCCCC(0);
var : DDD(0),DDDD(0),DDDDD(0),DDDDDD(0);
var : EEEEE(0),mAAAAA(0),mColor(0);
AAA = 0.5;
CCCCC = 0.0;
DDD = 0.0;
DDDDDD = 0.0;
EEEEE = 0.0;
BBBBBB = MACD(BBBB, BBBBB);
CCC = lowest(BBBBBB, EEEEEE);
CCCC = highest(BBBBBB, EEEEEE) - CCC;
CCCCC = iff(CCCC > 0 , (BBBBBB - CCC) / CCCC * 100 , CCCCC);
DDD = iff(IsNan(DDD[1]) == true, CCCCC , DDD[1] + AAA * (CCCCC - DDD[1]));
DDDD = lowest(DDD, EEEEEE);
DDDDD = highest(DDD, EEEEEE) - DDDD;
DDDDDD = iff(DDDDD > 0 , (DDD - DDDD) / DDDDD * 100 , DDDDDD);
EEEEE = iff(IsNan(EEEEE[1]) == true, DDDDDD , EEEEE[1] + AAA * (DDDDDD - EEEEE[1]));
mAAAAA = EEEEE;
mColor = iff(mAAAAA > mAAAAA[1] , green , red);
plot1(mAAAAA, "STC", mColor,def,2);
plot2(25, "ul",gray);
plot3(75, "ll",gray);
즐거운 하루되세요
> 부호장자 님이 쓴 글입니다.
> 제목 : 수식수정 문의
> 안녕하세요.
트레이딩뷰 지표인 STC INDICATOP를 아래와 같이 예스랭귀지로 변환하면
STC 본선의 모양은 거의 동일하게 구현이 되는데 첨부파일에서와 같이
선의 색상이 바뀌는 지점이 다르게 나타나는 경우가 있습니다.
특히 STC라인이 상단과 하단에 있을 때 초록색이 빨간색으로/
빨간색이 초록색으로 바뀌는 지점에서 그런 현상이 많이 나타나고 있습니다.
이 오류부분을 수정해 주시면 감사하겠습니다.
STC는 색상이 바뀌는 지점이 매매 타점이어서 중요합니다.
부탁드립니다.
input : length(20);
input : typeMA(0);#0:sma, 1: ema, 2:rma, 3:WMa, 4: vwma
input : smoothingLength(5);
var : src(0),mav(0),cnt(0),cciv(0),smoothingLine(0);
var : alpha(0);
src = (h+l+c)/3;
mav = ma(src, length);
cciv = (src - mav) / (0.015 *AvgDeviation(src,length));
if typeMA == 0 Then
smoothingLine = ma(cciv, smoothingLength);
else if typeMA == 1 Then
smoothingLine = ema(cciv, smoothingLength);
else if typeMA == 2 Then
{
alpha = 1/length;
smoothingLine = 0.0;
smoothingLine = iff(isnan(smoothingLine[1]) == true,ma(cciv, length), alpha * cciv + (1 - alpha) * smoothingLine[1]);
}
else if typeMA == 3 Then
smoothingLine = wma(cciv, smoothingLength);
Else
smoothingLine = ma(cciv * volume, smoothingLength) / ma(volume, smoothingLength);
plot1(cciv, "CCI",Blue);
plot2(smoothingLine, "Smoothing Line", Orange);
PlotBaseLine1(100, "Upper Band",Gray);
PlotBaseLine2(0, "Middle Band",Gray);
PlotBaseLine3(-100, "Lower Band",Gray);
============================================================
트레이딩뷰 소스코드
//@version=5
//[SHK] STC colored indicator
//https://www.tradingview.com/u/shayankm/
indicator(title='[SHK] Schaff Trend Cycle (STC)', shorttitle='STC', overlay=false)
EEEEEE = input(12, 'Length')
BBBB = input(26, 'FastLength')
BBBBB = input(50, 'SlowLength')
AAAA(BBB, BBBB, BBBBB) =>
fastMA = ta.ema(BBB, BBBB)
slowMA = ta.ema(BBB, BBBBB)
AAAA = fastMA - slowMA
AAAA
AAAAA(EEEEEE, BBBB, BBBBB) =>
AAA = input(0.5)
var CCCCC = 0.0
var DDD = 0.0
var DDDDDD = 0.0
var EEEEE = 0.0
BBBBBB = AAAA(close, BBBB, BBBBB)
CCC = ta.lowest(BBBBBB, EEEEEE)
CCCC = ta.highest(BBBBBB, EEEEEE) - CCC
CCCCC := CCCC > 0 ? (BBBBBB - CCC) / CCCC * 100 : nz(CCCCC[1])
DDD := na(DDD[1]) ? CCCCC : DDD[1] + AAA * (CCCCC - DDD[1])
DDDD = ta.lowest(DDD, EEEEEE)
DDDDD = ta.highest(DDD, EEEEEE) - DDDD
DDDDDD := DDDDD > 0 ? (DDD - DDDD) / DDDDD * 100 : nz(DDDDDD[1])
EEEEE := na(EEEEE[1]) ? DDDDDD : EEEEE[1] + AAA * (DDDDDD - EEEEE[1])
EEEEE
mAAAAA = AAAAA(EEEEEE, BBBB, BBBBB)
mColor = mAAAAA > mAAAAA[1] ? color.new(color.green, 20) : color.new(color.red, 20)
if mAAAAA[3] <= mAAAAA[2] and mAAAAA[2] > mAAAAA[1] and mAAAAA > 75
alert("Red", alert.freq_once_per_bar)
if mAAAAA[3] >= mAAAAA[2] and mAAAAA[2] < mAAAAA[1] and mAAAAA < 25
alert("Green", alert.freq_once_per_bar)
plot(mAAAAA, color=mColor, title='STC', linewidth=2)
ul = plot(25, color=color.new(color.gray, 70))
ll = plot(75, color=color.new(color.gray, 70))
fill(ul, ll, color=color.new(color.gray, 96))