커뮤니티
수식작성 부탁드립니다.

2024-01-22 19:44:36
1306
글번호 175962
첨부 이미지
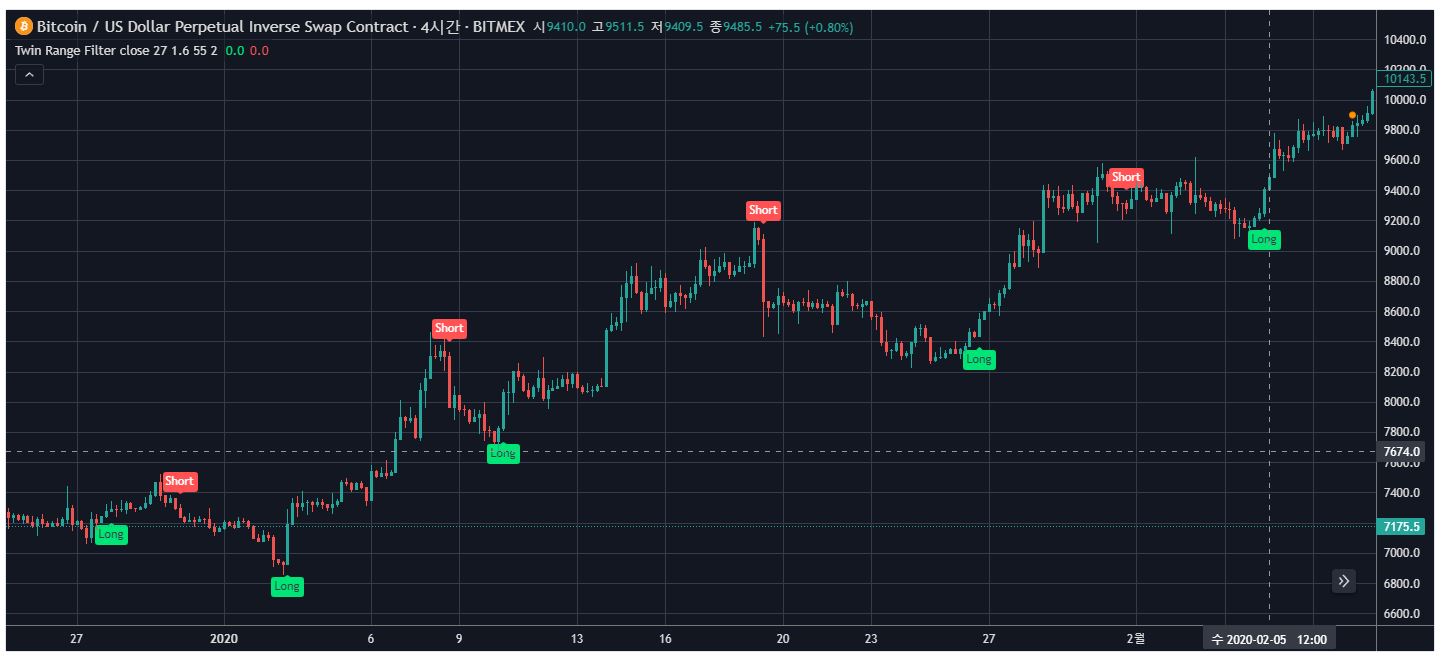
그림1

안녕하세요. 운영자님
이번에 꼭좀 부탁드릴 사항은 다음의 트레이딩뷰 지표를 예스트레이더로 변환을 해주십사합니다.
//@version=4
study(title="Twin Range Filter", overlay=true)
source = input(defval=close, title="Source")
// Smooth Average Range
per1 = input(defval=27, minval=1, title="Fast period")
mult1 = input(defval=1.6, minval=0.1, title="Fast range")
per2 = input(defval=55, minval=1, title="Slow period")
mult2 = input(defval=2, minval=0.1, title="Slow range")
smoothrng(x, t, m) =>
wper = t * 2 - 1
avrng = ema(abs(x - x[1]), t)
smoothrng = ema(avrng, wper) * m
smoothrng
smrng1 = smoothrng(source, per1, mult1)
smrng2 = smoothrng(source, per2, mult2)
smrng = (smrng1 + smrng2) / 2
// Range Filter
rngfilt(x, r) =>
rngfilt = x
rngfilt := x > nz(rngfilt[1]) ? x - r < nz(rngfilt[1]) ? nz(rngfilt[1]) : x - r :
x + r > nz(rngfilt[1]) ? nz(rngfilt[1]) : x + r
rngfilt
filt = rngfilt(source, smrng)
upward = 0.0
upward := filt > filt[1] ? nz(upward[1]) + 1 : filt < filt[1] ? 0 : nz(upward[1])
downward = 0.0
downward := filt < filt[1] ? nz(downward[1]) + 1 : filt > filt[1] ? 0 : nz(downward[1])
hband = filt + smrng
lband = filt - smrng
longCond = bool(na)
shortCond = bool(na)
longCond := source > filt and source > source[1] and upward > 0 or source > filt and source < source[1] and upward > 0
shortCond := source < filt and source < source[1] and downward > 0 or source < filt and source > source[1] and downward > 0
CondIni = 0
CondIni := longCond ? 1 : shortCond ? -1 : CondIni[1]
long = longCond and CondIni[1] == -1
short = shortCond and CondIni[1] == 1
// Plotting
plotshape(long, title="Long", text="Long", style=shape.labelup, textcolor=color.black, size=size.tiny, location=location.belowbar, color=color.lime, transp=0)
plotshape(short, title="Short", text="Short", style=shape.labeldown, textcolor=color.white, size=size.tiny, location=location.abovebar, color=color.red, transp=0)
// Alerts
alertcondition(long, title="Long", message="Long")
alertcondition(short, title="Short", message="Short")
- 1. Twin_Range_Filter.JPG (0.11 MB)
답변 2

예스스탁 예스스탁 답변
2024-01-23 15:04:50
안녕하세요
예스스탁입니다.
input : source(close);
input : per1(27);
input : mult1(1.6);
input : per2(55);
input : mult2(2);
var : wper1(0),avrng1(0),smrng1(0);
var : wper2(0),avrng2(0),smrng2(0);
var : smrng(0),filt(0);
var : upward(0),downward(0);
var : hband(0),lband(0);
var : longCond(False),shortcond(False),CondIni(0);
var : long(False),short(False),tx(0);
wper1 = per1 * 2 - 1;
avrng1 = ema(abs(source - source[1]), per1);
smrng1 = ema(avrng1, wper1) * mult1;
wper2 = per2 * 2 - 1;
avrng2 = ema(abs(source - source[1]), per2);
smrng2 = ema(avrng2, wper2) * mult2;
smrng = (smrng1 + smrng2) / 2;
// Range Filter
#rngfilt(source, smrng) =>
var1 = iff(IsNaN(filt[1])==true,0,filt[1]);
filt = source;
filt = iff(source > var1,
iff(source - smrng < var1 , var1 , source - smrng),
iff(source + smrng > var1 , var1 , source + smrng));
var2 = iff(IsNaN(upward[1])==true,0,upward[1]);
upward = 0.0;
upward = iff(filt > filt[1] , Var2 + 1 ,IFf(filt < filt[1] , 0 , Var2));
var3 = iff(IsNaN(downward[1])==true,0,downward[1]);
downward = 0.0;
downward = iff(filt < filt[1] , Var3 + 1 , iff(filt > filt[1] , 0 , Var3));
hband = filt + smrng;
lband = filt - smrng;
longCond = source > filt and source > source[1] and upward > 0 or source > filt and source < source[1] and upward > 0;
shortCond = source < filt and source < source[1] and downward > 0 or source < filt and source > source[1] and downward > 0;
CondIni = IFf(longCond , 1 , IFf(shortCond , -1 , CondIni[1]));
long = longCond and CondIni[1] == -1;
short = shortCond and CondIni[1] == 1;
if long Then
{
tx = Text_New(sDate,sTime,L,"Long");
Text_SetStyle(tx,2,0);
Text_SetColor(tx,Lime);
}
if short Then
{
tx = Text_New(sDate,sTime,H,"Short");
Text_SetStyle(tx,2,1);
Text_SetColor(tx,Red);
}
즐거운 하루되세요
> 고박사122 님이 쓴 글입니다.
> 제목 : 수식작성 부탁드립니다.
> 안녕하세요. 운영자님
이번에 꼭좀 부탁드릴 사항은 다음의 트레이딩뷰 지표를 예스트레이더로 변환을 해주십사합니다.
//@version=4
study(title="Twin Range Filter", overlay=true)
source = input(defval=close, title="Source")
// Smooth Average Range
per1 = input(defval=27, minval=1, title="Fast period")
mult1 = input(defval=1.6, minval=0.1, title="Fast range")
per2 = input(defval=55, minval=1, title="Slow period")
mult2 = input(defval=2, minval=0.1, title="Slow range")
smoothrng(x, t, m) =>
wper = t * 2 - 1
avrng = ema(abs(x - x[1]), t)
smoothrng = ema(avrng, wper) * m
smoothrng
smrng1 = smoothrng(source, per1, mult1)
smrng2 = smoothrng(source, per2, mult2)
smrng = (smrng1 + smrng2) / 2
// Range Filter
rngfilt(x, r) =>
rngfilt = x
rngfilt := x > nz(rngfilt[1]) ? x - r < nz(rngfilt[1]) ? nz(rngfilt[1]) : x - r :
x + r > nz(rngfilt[1]) ? nz(rngfilt[1]) : x + r
rngfilt
filt = rngfilt(source, smrng)
upward = 0.0
upward := filt > filt[1] ? nz(upward[1]) + 1 : filt < filt[1] ? 0 : nz(upward[1])
downward = 0.0
downward := filt < filt[1] ? nz(downward[1]) + 1 : filt > filt[1] ? 0 : nz(downward[1])
hband = filt + smrng
lband = filt - smrng
longCond = bool(na)
shortCond = bool(na)
longCond := source > filt and source > source[1] and upward > 0 or source > filt and source < source[1] and upward > 0
shortCond := source < filt and source < source[1] and downward > 0 or source < filt and source > source[1] and downward > 0
CondIni = 0
CondIni := longCond ? 1 : shortCond ? -1 : CondIni[1]
long = longCond and CondIni[1] == -1
short = shortCond and CondIni[1] == 1
// Plotting
plotshape(long, title="Long", text="Long", style=shape.labelup, textcolor=color.black, size=size.tiny, location=location.belowbar, color=color.lime, transp=0)
plotshape(short, title="Short", text="Short", style=shape.labeldown, textcolor=color.white, size=size.tiny, location=location.abovebar, color=color.red, transp=0)
// Alerts
alertcondition(long, title="Long", message="Long")
alertcondition(short, title="Short", message="Short")
해피오
2024-02-15 10:17:27
차트에 적용시 buy나 sell이 없어 예스편집기에는 검증되어도
차트상에서는 파일명이 나오지 않는다고 하는데요..
> 예스스탁 님이 쓴 글입니다.
> 제목 : Re : 수식작성 부탁드립니다.
> 안녕하세요
예스스탁입니다.
input : source(close);
input : per1(27);
input : mult1(1.6);
input : per2(55);
input : mult2(2);
var : wper1(0),avrng1(0),smrng1(0);
var : wper2(0),avrng2(0),smrng2(0);
var : smrng(0),filt(0);
var : upward(0),downward(0);
var : hband(0),lband(0);
var : longCond(False),shortcond(False),CondIni(0);
var : long(False),short(False),tx(0);
wper1 = per1 * 2 - 1;
avrng1 = ema(abs(source - source[1]), per1);
smrng1 = ema(avrng1, wper1) * mult1;
wper2 = per2 * 2 - 1;
avrng2 = ema(abs(source - source[1]), per2);
smrng2 = ema(avrng2, wper2) * mult2;
smrng = (smrng1 + smrng2) / 2;
// Range Filter
#rngfilt(source, smrng) =>
var1 = iff(IsNaN(filt[1])==true,0,filt[1]);
filt = source;
filt = iff(source > var1,
iff(source - smrng < var1 , var1 , source - smrng),
iff(source + smrng > var1 , var1 , source + smrng));
var2 = iff(IsNaN(upward[1])==true,0,upward[1]);
upward = 0.0;
upward = iff(filt > filt[1] , Var2 + 1 ,IFf(filt < filt[1] , 0 , Var2));
var3 = iff(IsNaN(downward[1])==true,0,downward[1]);
downward = 0.0;
downward = iff(filt < filt[1] , Var3 + 1 , iff(filt > filt[1] , 0 , Var3));
hband = filt + smrng;
lband = filt - smrng;
longCond = source > filt and source > source[1] and upward > 0 or source > filt and source < source[1] and upward > 0;
shortCond = source < filt and source < source[1] and downward > 0 or source < filt and source > source[1] and downward > 0;
CondIni = IFf(longCond , 1 , IFf(shortCond , -1 , CondIni[1]));
long = longCond and CondIni[1] == -1;
short = shortCond and CondIni[1] == 1;
if long Then
{
tx = Text_New(sDate,sTime,L,"Long");
Text_SetStyle(tx,2,0);
Text_SetColor(tx,Lime);
}
if short Then
{
tx = Text_New(sDate,sTime,H,"Short");
Text_SetStyle(tx,2,1);
Text_SetColor(tx,Red);
}
즐거운 하루되세요
> 고박사122 님이 쓴 글입니다.
> 제목 : 수식작성 부탁드립니다.
> 안녕하세요. 운영자님
이번에 꼭좀 부탁드릴 사항은 다음의 트레이딩뷰 지표를 예스트레이더로 변환을 해주십사합니다.
//@version=4
study(title="Twin Range Filter", overlay=true)
source = input(defval=close, title="Source")
// Smooth Average Range
per1 = input(defval=27, minval=1, title="Fast period")
mult1 = input(defval=1.6, minval=0.1, title="Fast range")
per2 = input(defval=55, minval=1, title="Slow period")
mult2 = input(defval=2, minval=0.1, title="Slow range")
smoothrng(x, t, m) =>
wper = t * 2 - 1
avrng = ema(abs(x - x[1]), t)
smoothrng = ema(avrng, wper) * m
smoothrng
smrng1 = smoothrng(source, per1, mult1)
smrng2 = smoothrng(source, per2, mult2)
smrng = (smrng1 + smrng2) / 2
// Range Filter
rngfilt(x, r) =>
rngfilt = x
rngfilt := x > nz(rngfilt[1]) ? x - r < nz(rngfilt[1]) ? nz(rngfilt[1]) : x - r :
x + r > nz(rngfilt[1]) ? nz(rngfilt[1]) : x + r
rngfilt
filt = rngfilt(source, smrng)
upward = 0.0
upward := filt > filt[1] ? nz(upward[1]) + 1 : filt < filt[1] ? 0 : nz(upward[1])
downward = 0.0
downward := filt < filt[1] ? nz(downward[1]) + 1 : filt > filt[1] ? 0 : nz(downward[1])
hband = filt + smrng
lband = filt - smrng
longCond = bool(na)
shortCond = bool(na)
longCond := source > filt and source > source[1] and upward > 0 or source > filt and source < source[1] and upward > 0
shortCond := source < filt and source < source[1] and downward > 0 or source < filt and source > source[1] and downward > 0
CondIni = 0
CondIni := longCond ? 1 : shortCond ? -1 : CondIni[1]
long = longCond and CondIni[1] == -1
short = shortCond and CondIni[1] == 1
// Plotting
plotshape(long, title="Long", text="Long", style=shape.labelup, textcolor=color.black, size=size.tiny, location=location.belowbar, color=color.lime, transp=0)
plotshape(short, title="Short", text="Short", style=shape.labeldown, textcolor=color.white, size=size.tiny, location=location.abovebar, color=color.red, transp=0)
// Alerts
alertcondition(long, title="Long", message="Long")
alertcondition(short, title="Short", message="Short")
다음글
이전글