커뮤니티
문의

2023-11-07 14:25:49
1471
글번호 173815
첨부 이미지
그림1

input : StartTime(223000),EndTime(233000);
var : Tcond(false),HH(0),LL(0);
if (sdate != sdate[1] and stime >= EndTime) or
(sdate == sdate[1] and stime >= EndTime and stime[1] < EndTime) Then
{
Tcond = False;
}
if (sdate != sdate[1] and stime >= StartTime) or
(sdate == sdate[1] and stime >= StartTime and stime[1] < StartTime) Then
{
Tcond = true;
HH = H;
LL = L;
}
if Tcond == true Then
{
if h > hh Then
hh = h;
if l > ll Then
hh = l;
}
if hh > 0 and ll > 0 Then
{
Plot1(hh);
plot2(ll);
}
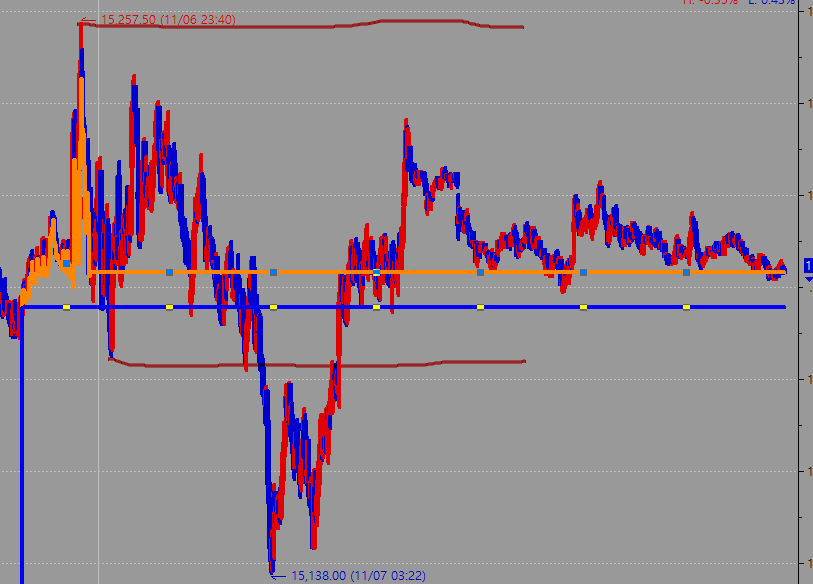
수식대로 하니까 오렌지색 하고 푸른색라인으로 나오는데, 고동색라인처름 나오게 부탁드립니다
- 1. 나스닥1.png (0.01 MB)
답변 1

예스스탁 예스스탁 답변
2023-11-07 14:52:15
안녕하세요
예스스탁입니다.
input : StartTime(223000),EndTime(233000);
var : Tcond(false),HH(0),LL(0);
if (sdate != sdate[1] and stime >= EndTime) or
(sdate == sdate[1] and stime >= EndTime and stime[1] < EndTime) Then
{
Tcond = False;
}
if (sdate != sdate[1] and stime >= StartTime) or
(sdate == sdate[1] and stime >= StartTime and stime[1] < StartTime) Then
{
Tcond = true;
HH = H;
LL = L;
}
if Tcond == true Then
{
if h > hh Then
hh = h;
if l < ll Then
ll = l;
}
if hh > 0 and ll > 0 Then
{
Plot1(hh);
plot2(ll);
}
즐거운 하루되세요
> 레전드 님이 쓴 글입니다.
> 제목 : 문의
>
input : StartTime(223000),EndTime(233000);
var : Tcond(false),HH(0),LL(0);
if (sdate != sdate[1] and stime >= EndTime) or
(sdate == sdate[1] and stime >= EndTime and stime[1] < EndTime) Then
{
Tcond = False;
}
if (sdate != sdate[1] and stime >= StartTime) or
(sdate == sdate[1] and stime >= StartTime and stime[1] < StartTime) Then
{
Tcond = true;
HH = H;
LL = L;
}
if Tcond == true Then
{
if h > hh Then
hh = h;
if l > ll Then
hh = l;
}
if hh > 0 and ll > 0 Then
{
Plot1(hh);
plot2(ll);
}
수식대로 하니까 오렌지색 하고 푸른색라인으로 나오는데, 고동색라인처름 나오게 부탁드립니다
이전글