커뮤니티
재문의 드립니다.

2023-11-06 10:51:57
1145
글번호 173740
첨부 이미지
그림1

그림2

//author Jurij 2015
//default moving average period is 4H because '4h' is missing in the resolution 드롭 down list
study("Multi Time Frame Exponential Moving Average", "MTF EMA", overlay=true)
ma_len = input(title="Length", type=integer, defval=100)
src = input(title="Source", type=source, defval=close)
ma_offset = input(title="Offset", type=integer, defval=0)
res = input(title="Resolution", type=resolution, defval="240")
htf_ma = ema(src, ma_len)
out = security(tickerid, res, htf_ma)
plot(out, color=red, offset=ma_offset)
트레이딩뷰 수식입니다.
이 수식으로 예전에 만들어준 수식이
Input : ntime(240),ma_len(100);
var : S1(0),D1(0),TM(0),TF1(0);
Var : Ep1(0), JISU1(0), PreJISU1(0);
Ep1 = 2/(ma_len+1);
if Bdate != Bdate[1] Then
{
S1 = TimeToMinutes(stime);
D1 = sdate;
}
if D1 > 0 then
{
if sdate == D1 Then
TM = TimeToMinutes(stime)-S1;
Else
TM = TimeToMinutes(stime)+1440-S1;
TF1 = TM%ntime;
if Bdate != Bdate[1] or
(Bdate == Bdate[1] and ntime > 1 and TF1 < TF1[1]) or
(Bdate == Bdate[1] and ntime > 1 and TM >= TM[1]+ntime) or
(Bdate == Bdate[1] and ntime == 1 and TM > TM[1]) Then
{
value1 = value1+1;
PreJISU1 = JISU1[1];
}
if value1 <= 1 then
{
JISU1 = C;
}
else{
JISU1 = C * EP1 + PreJISU1 * (1-EP1);
}
plot1(JiSu1);
}
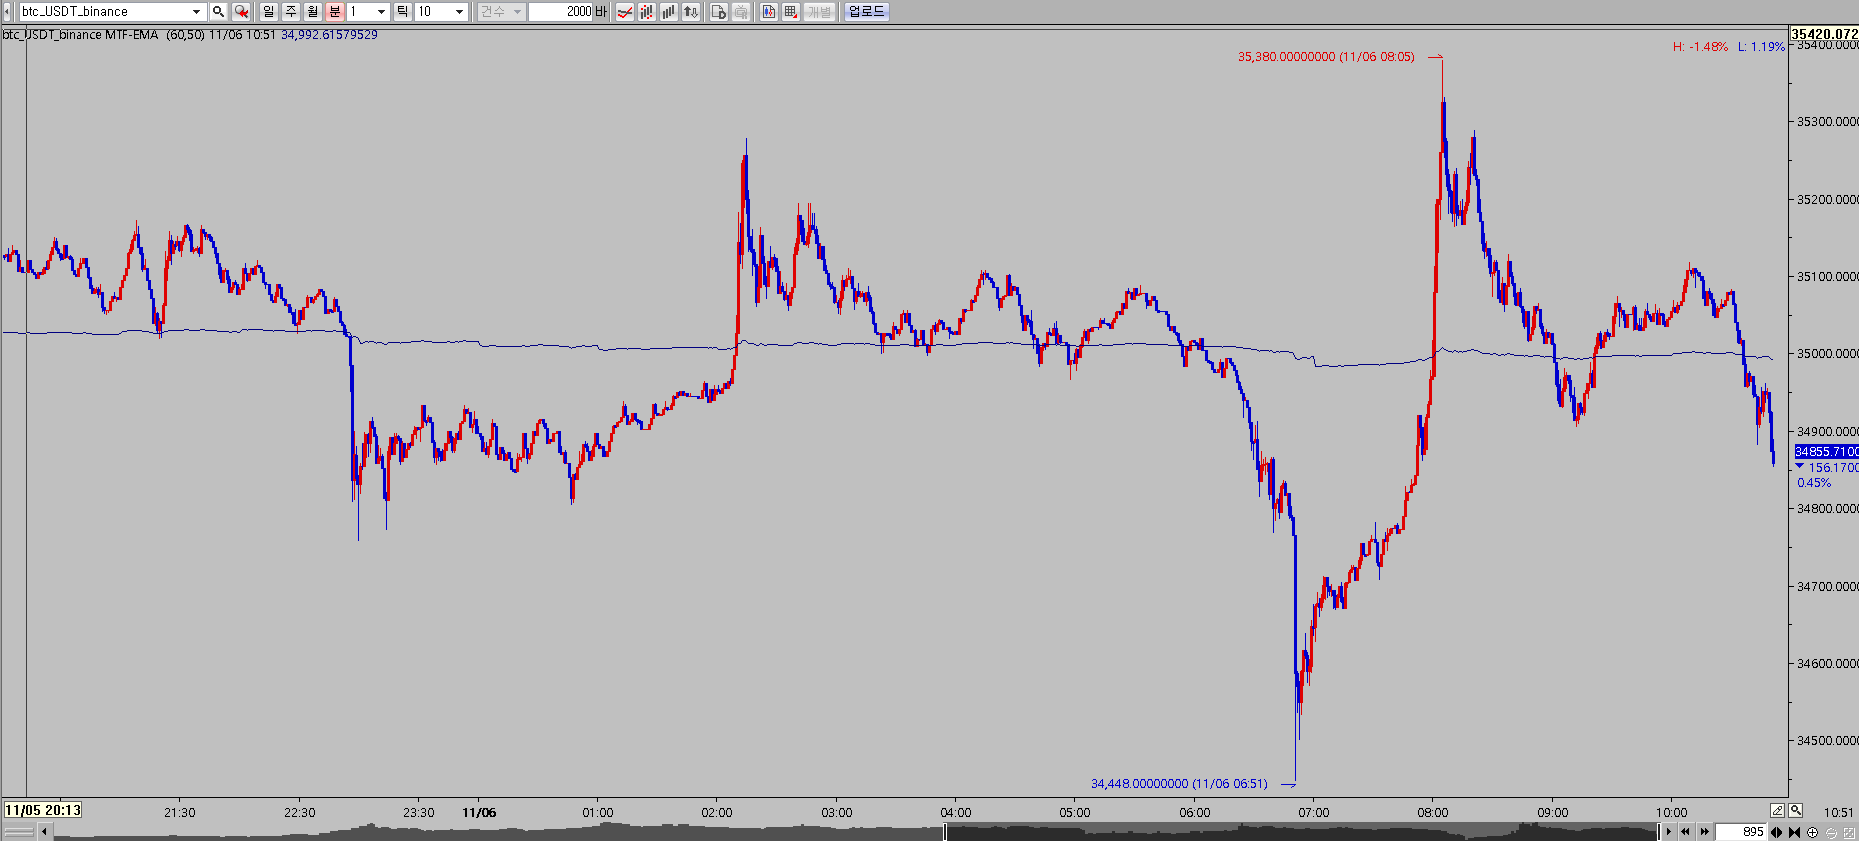
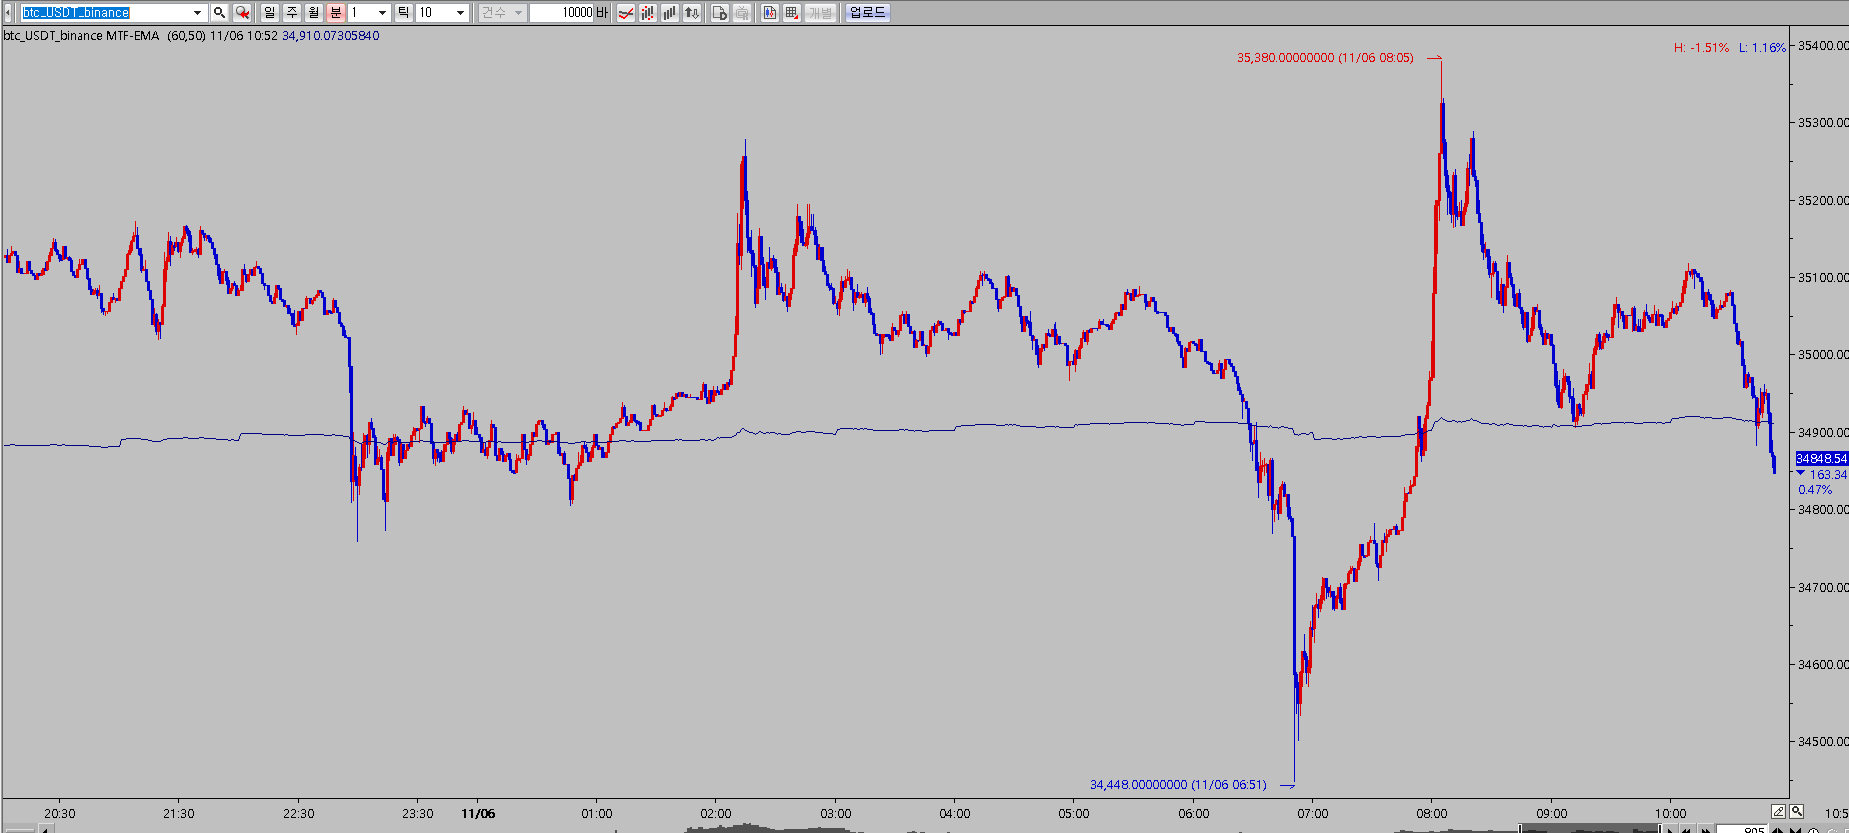
이건데 캔들 갯수를 늘리면 선이 고정이 안되고 움직임니다.
2000개로 했을때와
10000개로 했을때의 선이 다르게 나옵니다.
캔들 갯수를 늘려도 고정이 되도록 가능할까요?
- 1. 2023-11-06_105054.png (0.03 MB)
- 2. 2023-11-06_105117.png (0.03 MB)
답변 1

예스스탁 예스스탁 답변
2023-11-06 14:47:47
안녕하세요
예스스탁입니다.
지수이평과 같은 이동평균법은 그 계산방법에 의해 과거 봉수에 영향을 받습니다.
과거봉의 양향이 시간이 지남에 따라 소멸해 가게 됩니다.
해당 부분은 저희가 수식으로 수정할 수 없는 부분입니다.
기본으로 제공되는 지표 중 지수이동평균을 적용해 보시면
차트의 조회된 봉수가 50개, 100개, 200개 일때
조회된 봉수에 따라 값이 변하는 것을 확인할 수 있습니다.
차트의 봉수가 일정이상 많아지면 이후에 현재봉에서 거의 변화가 없습니다.
해당식은 특히나 타주기를 구현한 내용이므로
기본차트에서 타주기의 봉수로는 갯수가 훨씩 작아지게 됩니다.
차트에 최대한 많은 봉을 조회해서 보시는 방법뿐이 없습니다.
즐거운 하루되세요
> 신대륙발견 님이 쓴 글입니다.
> 제목 : 재문의 드립니다.
> //author Jurij 2015
//default moving average period is 4H because '4h' is missing in the resolution 드롭 down list
study("Multi Time Frame Exponential Moving Average", "MTF EMA", overlay=true)
ma_len = input(title="Length", type=integer, defval=100)
src = input(title="Source", type=source, defval=close)
ma_offset = input(title="Offset", type=integer, defval=0)
res = input(title="Resolution", type=resolution, defval="240")
htf_ma = ema(src, ma_len)
out = security(tickerid, res, htf_ma)
plot(out, color=red, offset=ma_offset)
트레이딩뷰 수식입니다.
이 수식으로 예전에 만들어준 수식이
Input : ntime(240),ma_len(100);
var : S1(0),D1(0),TM(0),TF1(0);
Var : Ep1(0), JISU1(0), PreJISU1(0);
Ep1 = 2/(ma_len+1);
if Bdate != Bdate[1] Then
{
S1 = TimeToMinutes(stime);
D1 = sdate;
}
if D1 > 0 then
{
if sdate == D1 Then
TM = TimeToMinutes(stime)-S1;
Else
TM = TimeToMinutes(stime)+1440-S1;
TF1 = TM%ntime;
if Bdate != Bdate[1] or
(Bdate == Bdate[1] and ntime > 1 and TF1 < TF1[1]) or
(Bdate == Bdate[1] and ntime > 1 and TM >= TM[1]+ntime) or
(Bdate == Bdate[1] and ntime == 1 and TM > TM[1]) Then
{
value1 = value1+1;
PreJISU1 = JISU1[1];
}
if value1 <= 1 then
{
JISU1 = C;
}
else{
JISU1 = C * EP1 + PreJISU1 * (1-EP1);
}
plot1(JiSu1);
}
이건데 캔들 갯수를 늘리면 선이 고정이 안되고 움직임니다.
2000개로 했을때와
10000개로 했을때의 선이 다르게 나옵니다.
캔들 갯수를 늘려도 고정이 되도록 가능할까요?