커뮤니티
문의 드립니다.

2023-10-24 17:16:14
2444
글번호 173367
첨부 이미지
그림1

그림2

그림3

그림4

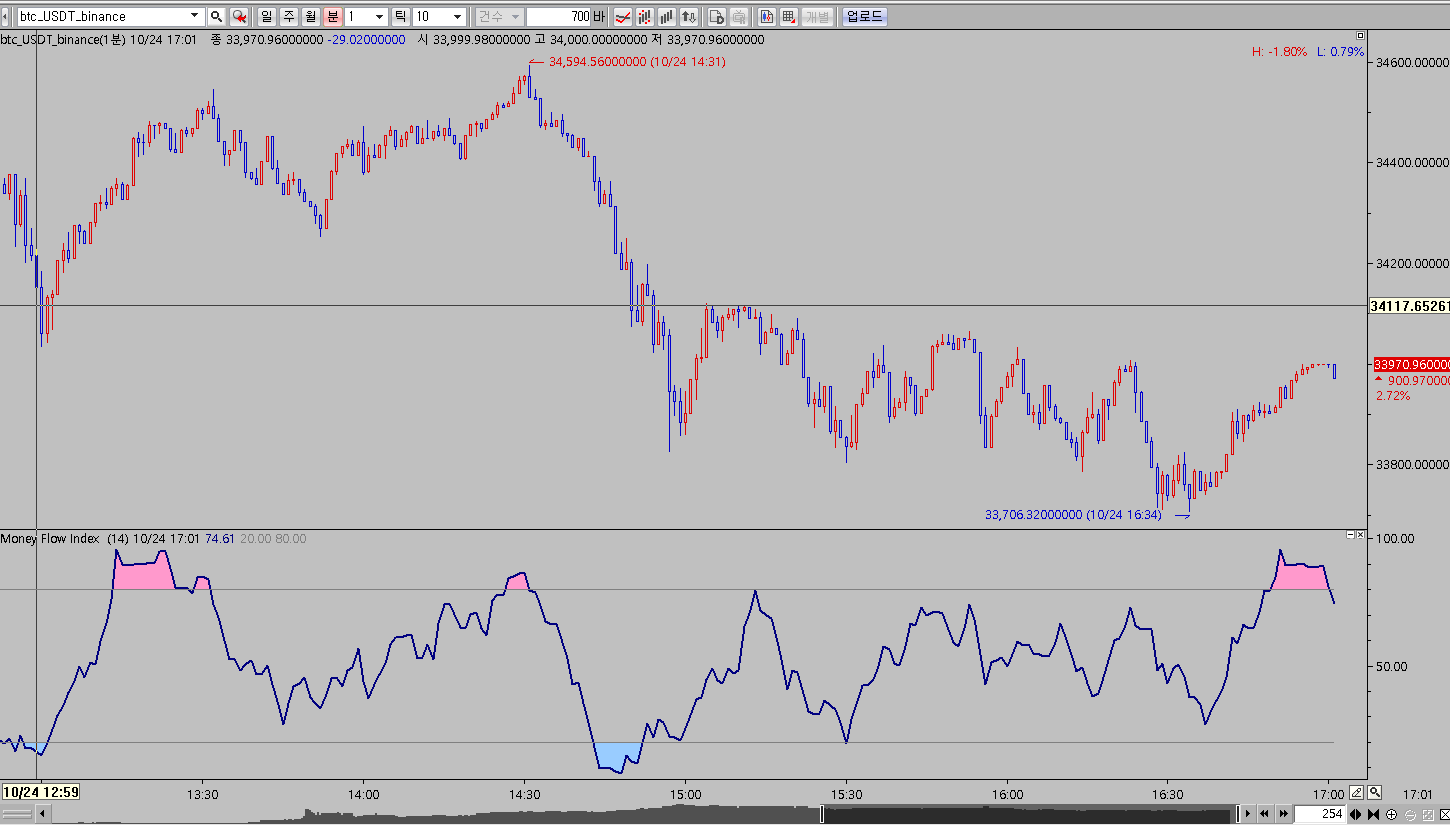
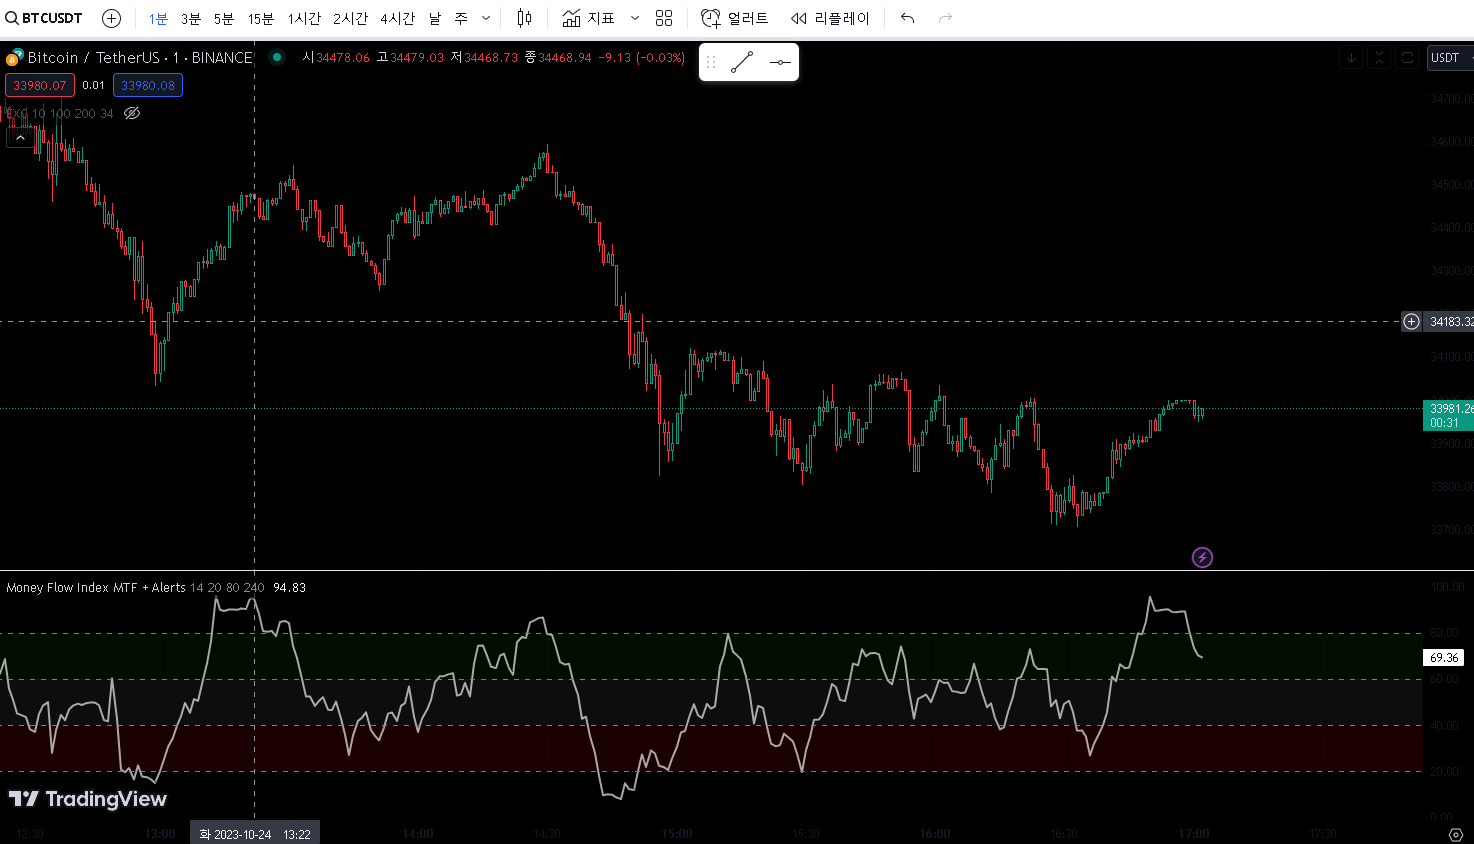
1분봉 차트에 money flow index 차트를 적용 시켰습니다.
기본 수치 14로 하면 트레이딩뷰 차트와 예스 차트에서는 모양이 동일합니다.
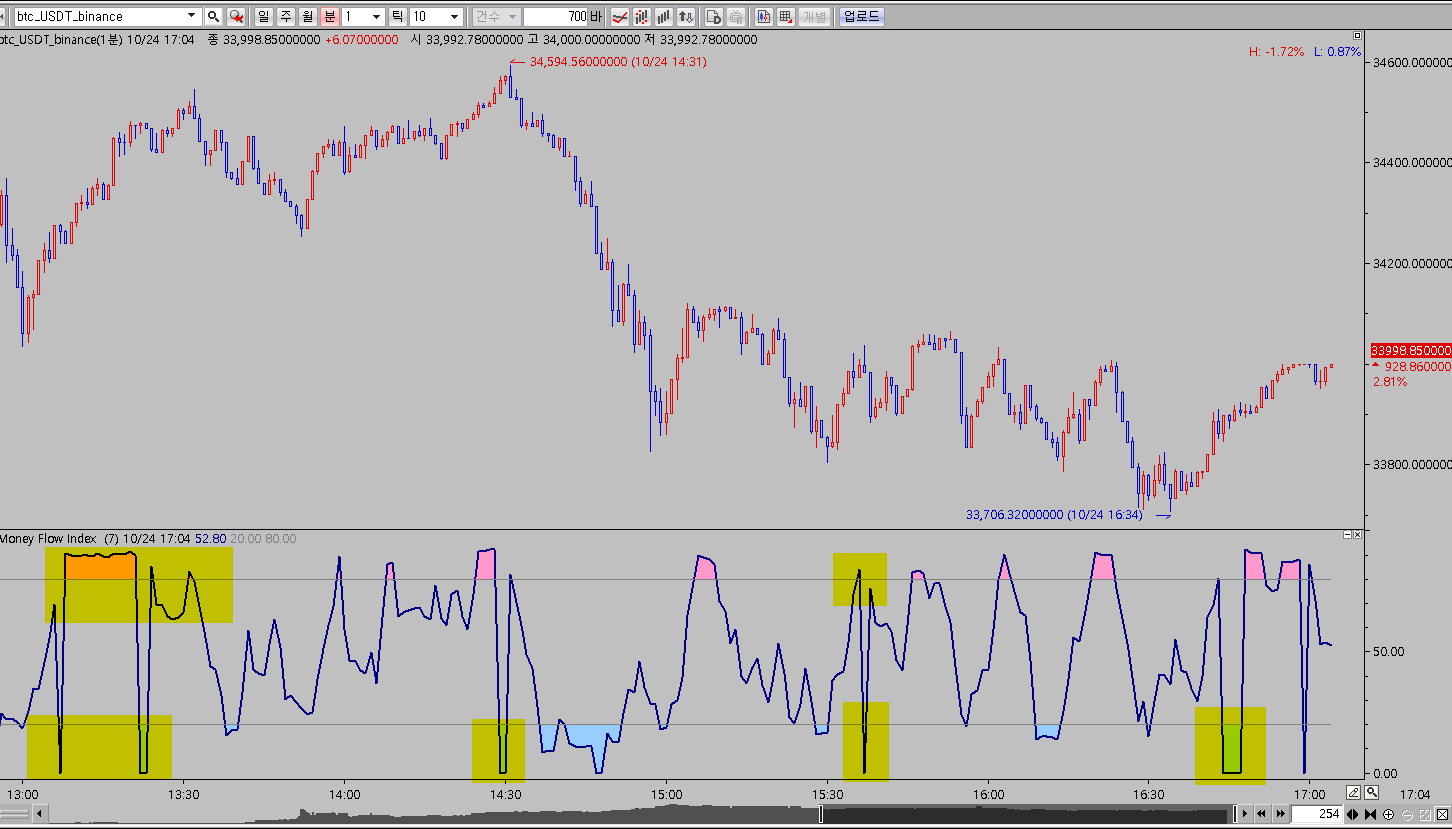
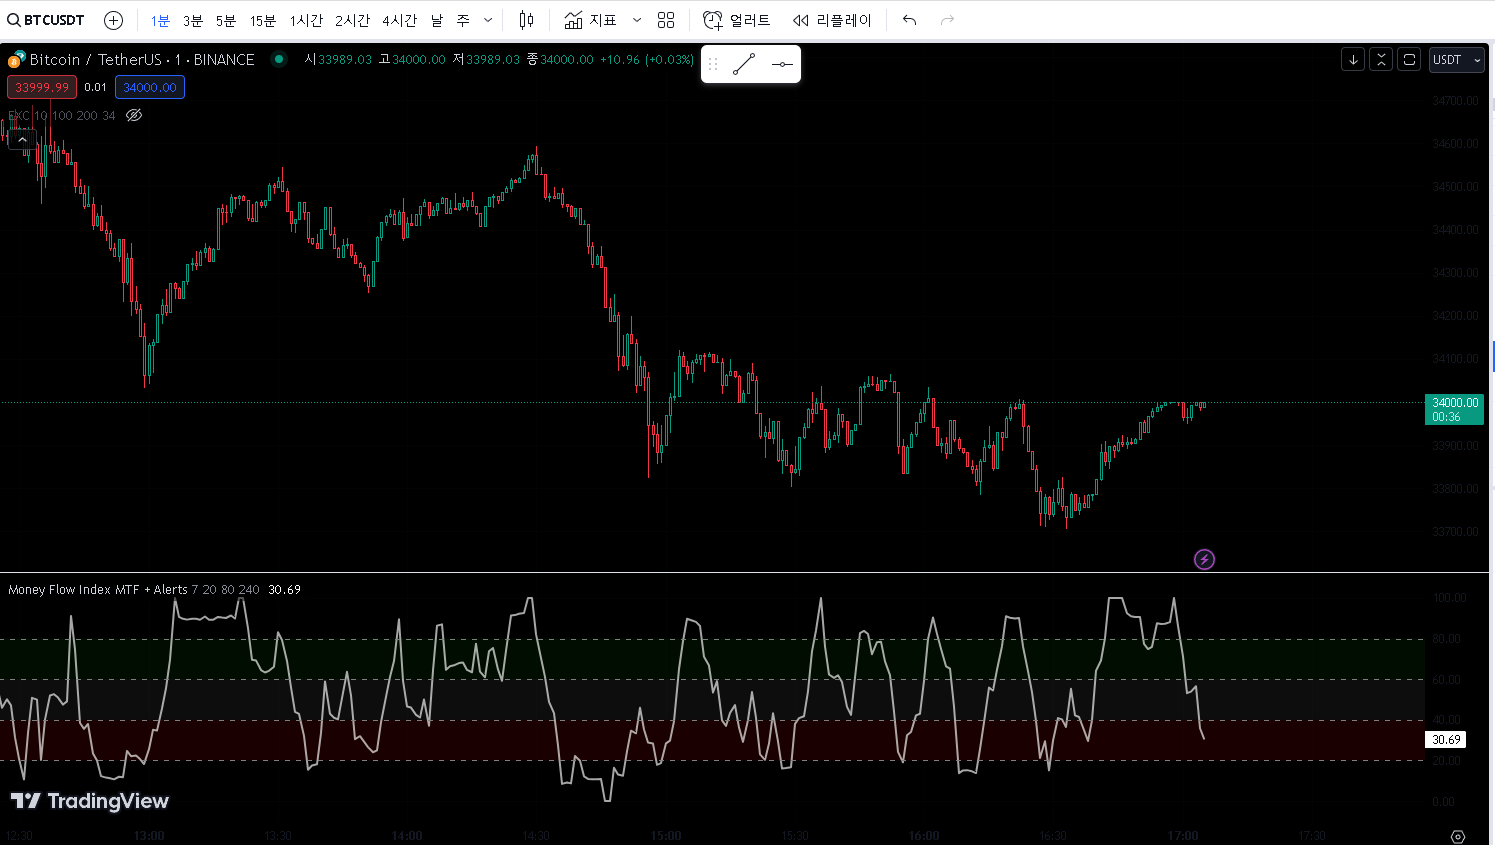
그런데 수치를 7로 바꿔주면 예스와 트레이딩뷰 차트 모양이 다르게 나옵니다.
수치를 바꿔을때도 트레이딩뷰와 동일하게 나오게 해주세요.
알람 수식등은 빼고 money flow index 수식만 바꿔주세요.
트레이딩뷰 수식입니다.
//@version=3
study("Money Flow Index MTF + Alerts", overlay = false)
////////////////////////////
// This study is based on the work of TV user Beasley Savage (https://www.tradingview.com/스크립트/g58H59ub-Money-Flow-Index-Beasley-Savage/)
// and all credit goes to them.
//
// Changes I've made:
//
// 1. Added a visual symbol of an overbought/oversold threshold cross in the form of a red/green circle, respectively.
// Sometimes it can be hard to see when a cross actually occurs, and if your scaling isn't set up properly you can get
// misleading visuals. This way removes all doubt. Bear in mind they aren't meant as trading signals, so DO NOT use them as such.
// Research the MFI if you're unsure, but I use them as an early warning and that particular market/stock is added to my watchlist.
//
// 2. Added 60/40 lines as the MFI respects these incredibly well in trends. E.g. in a solid uptrend the MFI won't go below 40,
// and vice versa. Use the idea of support and resistance levels on the indicator and it'll be a great help.
// I've coloured the zones. Strong uptrends should stay above 60, strong downtrends should stay below
// 40. The zone in between 40-60 I've called the transition zone. MFI often stays here in consolidation periods, and
// in the last leg of a cycle/trend the MFI will often 드롭 into this zone after being above 60 or below 40. This is a great
// sign that you should get out and start looking to reverse your position. Hopefully it helps to spot divergences as well.
//
// 3. Added alerts based on an overbought/oversold cross. Also added an alert for when either condition is triggered, so hopefully
// that's useful for those struggling with low alert limits. Feel free to change the overbought/oversold levels, the alerts +
// crossover visual are set to adapt.
//
// Any queries please comment or PM me.
//
// Cheers,
// RJR
//
////////////////////////////
// Version control
// ========================
// 1.0
// Initial Release
// 1.1
// Added support for multiple time frames
// Cleaned up code
// 1.1.1
// Minor error fix
////////////////////////////
//Inputs
length = input(title="Length", defval=14)
os = input(20, title="Oversold")
ob = input(80, title="Overbought")
CurrentRes = input(true, title="Use Current Chart Resolution?")
CustomRes = input("240", title="Custom Timeframe? Uncheck Box Above (E.g. 1M, 5D, 240 = 4Hours)")
//MFI Calc
res = CurrentRes ? period : CustomRes
rawMoneyFlow = hlc3 * volume
positiveMoneyFlow() =>
a = 0.0
a := hlc3 > hlc3[1] ? a + rawMoneyFlow : a
negativeMoneyFlow() =>
b = 0.0
b := hlc3 < hlc3[1] ? b + rawMoneyFlow : b
moneyFlowRatio = sma(positiveMoneyFlow(), length) / sma(negativeMoneyFlow(), length)
moneyFlowIndex = security(tickerid, res, 100 - 100 / (1 + moneyFlowRatio))
//OB/OS Identification
oversold = moneyFlowIndex[1] > os[1] and moneyFlowIndex < os
overbought = moneyFlowIndex[1] < ob[1] and moneyFlowIndex > ob
//Plotting
col = oversold ? green : red
plot(moneyFlowIndex, color=black, linewidth=2)
plot(oversold ? moneyFlowIndex : overbought ? moneyFlowIndex : na, title="Oversold/Overbought Cross", color=col, style=circles, linewidth=6)
h1 = hline(80, "Overbought")
h2 = hline(20, "Oversold")
h3 = hline(40, "Bears")
h4 = hline(60, "Bulls")
fill(h4, h1, color=green, title="Uptrend")
fill(h3, h2, color=red, title="Downtrend")
fill (h3, h4, color=gray, title="Transition Zone")
//Alerts
alert = oversold or overbought
alertcondition(oversold, title="MFI Oversold", message="MFI Crossed Oversold" )
alertcondition(overbought, title="MFI Overbought", message="MFI Crossed Overbought" )
alertcondition(alert, title="MFI Alert Both", message="MFI Alert Generated OB/OS" )
- 1. 2023-10-24_170045.png (0.03 MB)
- 2. 2023-10-24_170229.png (0.06 MB)
- 3. 2023-10-24_170318.png (0.03 MB)
- 4. 2023-10-24_170524.png (0.07 MB)
답변 1

예스스탁 예스스탁 답변
2023-10-25 10:22:08
안녕하세요
예스스탁입니다.
input : length(14),os(20),ob(80);
var : hlc3(0),rawMoneyFlow(0);
var : positiveMoneyFlow(0),negativeMoneyFlow(0);
var : moneyFlowRatio(0),moneyFlowIndex(0);
hlc3 = (h+l+c)/3;
rawMoneyFlow = hlc3 * volume;
positiveMoneyFlow = iff(hlc3 > hlc3[1] , rawMoneyFlow , 0);
negativeMoneyFlow = IFf(hlc3 < hlc3[1] , rawMoneyFlow , 0);
moneyFlowRatio = ma(positiveMoneyFlow, length) / ma(negativeMoneyFlow, length);
moneyFlowIndex = 100 - 100 / (1 + moneyFlowRatio);
plot1(moneyFlowIndex);
PlotBaseLine1(ob, "Overbought");
PlotBaseLine2(os, "Oversold");
즐거운 하루되세요
> 신대륙발견 님이 쓴 글입니다.
> 제목 : 문의 드립니다.
> 1분봉 차트에 money flow index 차트를 적용 시켰습니다.
기본 수치 14로 하면 트레이딩뷰 차트와 예스 차트에서는 모양이 동일합니다.
그런데 수치를 7로 바꿔주면 예스와 트레이딩뷰 차트 모양이 다르게 나옵니다.
수치를 바꿔을때도 트레이딩뷰와 동일하게 나오게 해주세요.
알람 수식등은 빼고 money flow index 수식만 바꿔주세요.
트레이딩뷰 수식입니다.
//@version=3
study("Money Flow Index MTF + Alerts", overlay = false)
////////////////////////////
// This study is based on the work of TV user Beasley Savage (https://www.tradingview.com/스크립트/g58H59ub-Money-Flow-Index-Beasley-Savage/)
// and all credit goes to them.
//
// Changes I've made:
//
// 1. Added a visual symbol of an overbought/oversold threshold cross in the form of a red/green circle, respectively.
// Sometimes it can be hard to see when a cross actually occurs, and if your scaling isn't set up properly you can get
// misleading visuals. This way removes all doubt. Bear in mind they aren't meant as trading signals, so DO NOT use them as such.
// Research the MFI if you're unsure, but I use them as an early warning and that particular market/stock is added to my watchlist.
//
// 2. Added 60/40 lines as the MFI respects these incredibly well in trends. E.g. in a solid uptrend the MFI won't go below 40,
// and vice versa. Use the idea of support and resistance levels on the indicator and it'll be a great help.
// I've coloured the zones. Strong uptrends should stay above 60, strong downtrends should stay below
// 40. The zone in between 40-60 I've called the transition zone. MFI often stays here in consolidation periods, and
// in the last leg of a cycle/trend the MFI will often 드롭 into this zone after being above 60 or below 40. This is a great
// sign that you should get out and start looking to reverse your position. Hopefully it helps to spot divergences as well.
//
// 3. Added alerts based on an overbought/oversold cross. Also added an alert for when either condition is triggered, so hopefully
// that's useful for those struggling with low alert limits. Feel free to change the overbought/oversold levels, the alerts +
// crossover visual are set to adapt.
//
// Any queries please comment or PM me.
//
// Cheers,
// RJR
//
////////////////////////////
// Version control
// ========================
// 1.0
// Initial Release
// 1.1
// Added support for multiple time frames
// Cleaned up code
// 1.1.1
// Minor error fix
////////////////////////////
//Inputs
length = input(title="Length", defval=14)
os = input(20, title="Oversold")
ob = input(80, title="Overbought")
CurrentRes = input(true, title="Use Current Chart Resolution?")
CustomRes = input("240", title="Custom Timeframe? Uncheck Box Above (E.g. 1M, 5D, 240 = 4Hours)")
//MFI Calc
res = CurrentRes ? period : CustomRes
rawMoneyFlow = hlc3 * volume
positiveMoneyFlow() =>
a = 0.0
a := hlc3 > hlc3[1] ? a + rawMoneyFlow : a
negativeMoneyFlow() =>
b = 0.0
b := hlc3 < hlc3[1] ? b + rawMoneyFlow : b
moneyFlowRatio = sma(positiveMoneyFlow(), length) / sma(negativeMoneyFlow(), length)
moneyFlowIndex = security(tickerid, res, 100 - 100 / (1 + moneyFlowRatio))
//OB/OS Identification
oversold = moneyFlowIndex[1] > os[1] and moneyFlowIndex < os
overbought = moneyFlowIndex[1] < ob[1] and moneyFlowIndex > ob
//Plotting
col = oversold ? green : red
plot(moneyFlowIndex, color=black, linewidth=2)
plot(oversold ? moneyFlowIndex : overbought ? moneyFlowIndex : na, title="Oversold/Overbought Cross", color=col, style=circles, linewidth=6)
h1 = hline(80, "Overbought")
h2 = hline(20, "Oversold")
h3 = hline(40, "Bears")
h4 = hline(60, "Bulls")
fill(h4, h1, color=green, title="Uptrend")
fill(h3, h2, color=red, title="Downtrend")
fill (h3, h4, color=gray, title="Transition Zone")
//Alerts
alert = oversold or overbought
alertcondition(oversold, title="MFI Oversold", message="MFI Crossed Oversold" )
alertcondition(overbought, title="MFI Overbought", message="MFI Crossed Overbought" )
alertcondition(alert, title="MFI Alert Both", message="MFI Alert Generated OB/OS" )
다음글
이전글