커뮤니티
이수식이용해서 매수매도하는 시스템 식 질문드립니다~

2018-05-24 15:26:55
241
글번호 119176
첨부 이미지
그림1

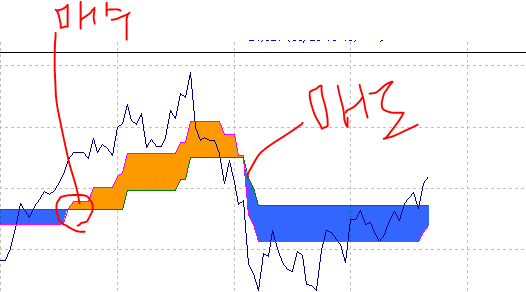
안녕하세요
이수식은 지표 수식인데 스크린샷처럼 시스템식에서 사용할라면 뭘 추가해야할지 알고싶어요
안녕하세요
예스스탁입니다.
올려주신 지표식에서 빨간색과 파란색이 어떤 선인지 모르겠습니다.
수식 내용에는 색상정보가 없습니다.
좀더 자세한 내용을 올려주시기 바랍니다
> 만두기 님이 쓴 글입니다.
> 제목 : 이 지표를 이용한 매수 매도 식은 어떻게 넣나요?
> 아래 보조지표인데
이것을 이용해서 빨간색이 나오면 매수 파란색이 나오면 매도가 돼는
시스템식은 어떻게 작성해야 하나요?
input: PeriodRSI(14); // Indicator period
input: StepSizeFast(5); // Fast step
input: StepSizeSlow(15); // Slow step
var: fmin(9999),fmax(-9999);
var: smin(9999),smax(-9999);
var: ftrend(1),strend(1);
var: RSI0(0);
//---- restore values of the variables
RSI0=RSI(PeriodRSI);
fmax=RSI0+2*StepSizeFast;
fmin=RSI0-2*StepSizeFast;
if(RSI0>fmax[1]) then ftrend=1;
if(RSI0<fmin[1]) then ftrend=-1;
if(ftrend>0 && fmin<fmin[1]) then fmin=fmin[1];
if(ftrend<0 && fmax>fmax[1]) then fmax=fmax[1];
smax=RSI0+2*StepSizeSlow;
smin=RSI0-2*StepSizeSlow;
if(RSI0>smax[1]) then strend=1;
if(RSI0<smin[1]) then strend=-1;
if(strend>0 && smin<smin[1]) then smin=smin[1];
if(strend<0 && smax>smax[1]) then smax=smax[1];
if(ftrend>0) then var3=fmin+StepSizeFast;
if(ftrend<0) then var3=fmax-StepSizeFast;
if(strend>0) then var4=smin+StepSizeSlow;
if(strend<0) then var4=smax-StepSizeSlow;
plot1(RSI0,"RSI");
plot2(var3,"Fast_Metro");
plot3(var4,"Slow_Metro");
PlotBaseLine1(30, "기준선 30");
PlotBaseLine2(70, "기준선 70");
- 1. KakaoTalk_20180523_192834389.png (0.01 MB)
답변 1

예스스탁 예스스탁 답변
2018-05-25 13:42:46
안녕하세요
예스스탁입니다.
교차해서 선사이의 색이 변경되는 선이
var3과 var4인것 같습니다.
var3과 var4교차에 따른 진입식을 작성해 드립니다.
input: PeriodRSI(14); // Indicator period
input: StepSizeFast(5); // Fast step
input: StepSizeSlow(15); // Slow step
var: fmin(9999),fmax(-9999);
var: smin(9999),smax(-9999);
var: ftrend(1),strend(1);
var: RSI0(0);
RSI0=RSI(PeriodRSI);
fmax=RSI0+2*StepSizeFast;
fmin=RSI0-2*StepSizeFast;
if(RSI0>fmax[1]) then ftrend=1;
if(RSI0<fmin[1]) then ftrend=-1;
if(ftrend>0 && fmin<fmin[1]) then fmin=fmin[1];
if(ftrend<0 && fmax>fmax[1]) then fmax=fmax[1];
smax=RSI0+2*StepSizeSlow;
smin=RSI0-2*StepSizeSlow;
if(RSI0>smax[1]) then strend=1;
if(RSI0<smin[1]) then strend=-1;
if(strend>0 && smin<smin[1]) then smin=smin[1];
if(strend<0 && smax>smax[1]) then smax=smax[1];
if(ftrend>0) then var3=fmin+StepSizeFast;
if(ftrend<0) then var3=fmax-StepSizeFast;
if(strend>0) then var4=smin+StepSizeSlow;
if(strend<0) then var4=smax-StepSizeSlow;
if crossup(var3,var4) Then
buy();
if CrossDown(var3,var4) Then
sell();
즐거운 하루되세요
> 만두기 님이 쓴 글입니다.
> 제목 : 이수식이용해서 매수매도하는 시스템 식 질문드립니다~
> 안녕하세요
이수식은 지표 수식인데 스크린샷처럼 시스템식에서 사용할라면 뭘 추가해야할지 알고싶어요
안녕하세요
예스스탁입니다.
올려주신 지표식에서 빨간색과 파란색이 어떤 선인지 모르겠습니다.
수식 내용에는 색상정보가 없습니다.
좀더 자세한 내용을 올려주시기 바랍니다
> 만두기 님이 쓴 글입니다.
> 제목 : 이 지표를 이용한 매수 매도 식은 어떻게 넣나요?
> 아래 보조지표인데
이것을 이용해서 빨간색이 나오면 매수 파란색이 나오면 매도가 돼는
시스템식은 어떻게 작성해야 하나요?
input: PeriodRSI(14); // Indicator period
input: StepSizeFast(5); // Fast step
input: StepSizeSlow(15); // Slow step
var: fmin(9999),fmax(-9999);
var: smin(9999),smax(-9999);
var: ftrend(1),strend(1);
var: RSI0(0);
//---- restore values of the variables
RSI0=RSI(PeriodRSI);
fmax=RSI0+2*StepSizeFast;
fmin=RSI0-2*StepSizeFast;
if(RSI0>fmax[1]) then ftrend=1;
if(RSI0<fmin[1]) then ftrend=-1;
if(ftrend>0 && fmin<fmin[1]) then fmin=fmin[1];
if(ftrend<0 && fmax>fmax[1]) then fmax=fmax[1];
smax=RSI0+2*StepSizeSlow;
smin=RSI0-2*StepSizeSlow;
if(RSI0>smax[1]) then strend=1;
if(RSI0<smin[1]) then strend=-1;
if(strend>0 && smin<smin[1]) then smin=smin[1];
if(strend<0 && smax>smax[1]) then smax=smax[1];
if(ftrend>0) then var3=fmin+StepSizeFast;
if(ftrend<0) then var3=fmax-StepSizeFast;
if(strend>0) then var4=smin+StepSizeSlow;
if(strend<0) then var4=smax-StepSizeSlow;
plot1(RSI0,"RSI");
plot2(var3,"Fast_Metro");
plot3(var4,"Slow_Metro");
PlotBaseLine1(30, "기준선 30");
PlotBaseLine2(70, "기준선 70");
다음글
이전글