커뮤니티
부탁 드립니다.

2017-02-09 21:48:07
205
글번호 106701
첨부 이미지
그림1

도움 주심에 감사 드립니다.
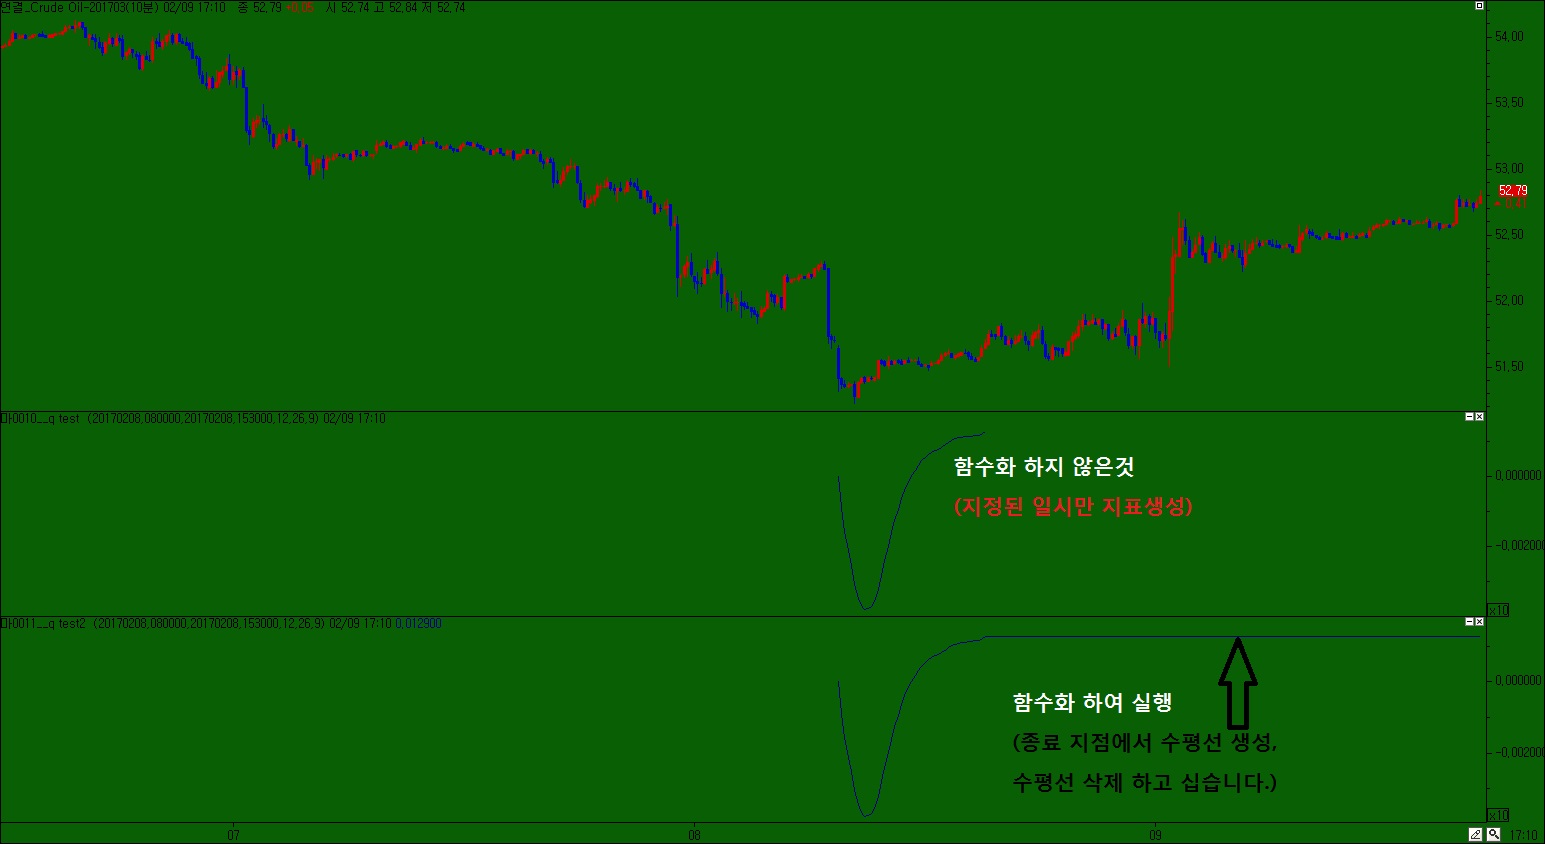
다음 수식을 실행한것과
이것을 함수화 하여 실행 한것이 차이가 있습니다.
그림처럼 함수화 한것의 수평선을 없애고 싶습니다.
미리 감사 드립니다.
input:시작년월일(20170208),시작시각(080000);
input:종료년월일(20170208),종료시각(153000);
input: Period1(12),Period2(26),Period3(9);
variables: VolumeValue( 0 ), MedPrice( 0 ), PV( 0 ),StartCalcDate(0),StartTime(0),
CumulativeVolume( 0 ), CumulativePV( 0 ), Started( false ), Denom( 0 ),
KeyCumVol( 0 ), KeyCumPV( 0 ), MidasValue( 0 ),endCalcDate(0),endTime(0) ;
Var : Ep1(0), JISU1(0),Ep2(0), JISU2(0),Ep3(0),Jisu3(0);
var : MACDVal(0),MACDSig(0),ii(0),SD(false),ED(false);
Ep1 = 2/(Period1+1);
Ep2 = 2/(Period2+1);
Ep3 = 2/(Period3+1);
StartCalcDate = 시작년월일;
StartTime = 시작시각;
endCalcDate = 종료년월일;
endTime = 종료시각;
if sdate == StartCalcDate and
(stime == StartTime or (stime > StartTime and stime[1] < StartTime)) Then
Started = true;
if Started == true and sdate == endCalcDate and
(stime >= endTime or (stime > endTime and stime[1]< endTime)) Then
Started = false;
if Started == true then
{
VolumeValue = iff( DataCompress < 1, Ticks, Volume ) ;
MedPrice = (H + L)/2 ;
PV = MedPrice * VolumeValue ;
CumulativeVolume = VolumeValue + CumulativeVolume ;
CumulativePV = PV + CumulativePV ;
}
if Started == true and Started[1] == false then
{
Started = true ;
Denom = 1 ;
KeyCumVol = CumulativeVolume ;
KeyCumPV = CumulativePV ;
}
else if Denom >= 1 then
Denom = CumulativeVolume - KeyCumVol ;
if Started then
{
if Denom > 1 then
MidasValue = ( CumulativePV - KeyCumPV ) / Denom ;
else if Denom == 1 then
MidasValue = MedPrice ;
ii = ii+1;
if ii <= 1 then {
JISU1 = MidasValue;
JISU2 = MidasValue;
MACDVal = JiSu1-Jisu2;
MACDsig = MACDVal;
}
else{
JISU1 = MidasValue * EP1 + JISU1[1] * (1-EP1);
JISU2 = MidasValue * EP2 + JISU2[1] * (1-EP2);
MACDVal = JiSu1-Jisu2;
MACDsig = MACDVal * EP3 + MACDsig[1] * (1-EP3);
}
plot1(MACDVal);
// plot2(MACDsig);
//PlotBaseLine1(0);
}
함수 실행파일:
input: 시작년월일(20170208),시작시각(080000);
input:종료년월일(20170208),종료시각(153000);
input: Period1(12),Period2(26),Period3(9);
var1=function_macd(시작년월일,시작시각,종료년월일,종료시각,Period1,Period2,Period3);
plot1(var1);
함수명:function_macd
input:시작년월일(numeric),시작시각(numeric);
input:종료년월일(numeric),종료시각(numeric);
input: Period1(numeric),Period2(numeric),Period3(numeric);
variables: VolumeValue( 0 ), MedPrice( 0 ), PV( 0 ),StartCalcDate(0),StartTime(0),
CumulativeVolume( 0 ), CumulativePV( 0 ), Started( false ), Denom( 0 ),
KeyCumVol( 0 ), KeyCumPV( 0 ), MidasValue( 0 ),endCalcDate(0),endTime(0) ;
Var : Ep1(0), JISU1(0),Ep2(0), JISU2(0),Ep3(0),Jisu3(0);
var : MACDVal(0),MACDSig(0),ii(0),SD(false),ED(false);
Ep1 = 2/(Period1+1);
Ep2 = 2/(Period2+1);
Ep3 = 2/(Period3+1);
StartCalcDate = 시작년월일;
StartTime = 시작시각;
endCalcDate = 종료년월일;
endTime = 종료시각;
if sdate == StartCalcDate and
(stime == StartTime or (stime > StartTime and stime[1] < StartTime)) Then
Started = true;
if Started == true and sdate == endCalcDate and
(stime >= endTime or (stime > endTime and stime[1]< endTime)) Then
Started = false;
if Started == true then
{
VolumeValue = iff( DataCompress < 1, Ticks, Volume ) ;
MedPrice = (H + L)/2 ;
PV = MedPrice * VolumeValue ;
CumulativeVolume = VolumeValue + CumulativeVolume ;
CumulativePV = PV + CumulativePV ;
}
if Started == true and Started[1] == false then
{
Started = true ;
Denom = 1 ;
KeyCumVol = CumulativeVolume ;
KeyCumPV = CumulativePV ;
}
else if Denom >= 1 then
Denom = CumulativeVolume - KeyCumVol ;
if Started then
{
if Denom > 1 then
MidasValue = ( CumulativePV - KeyCumPV ) / Denom ;
else if Denom == 1 then
MidasValue = MedPrice ;
ii = ii+1;
if ii <= 1 then {
JISU1 = MidasValue;
JISU2 = MidasValue;
MACDVal = JiSu1-Jisu2;
MACDsig = MACDVal;
}
else{
JISU1 = MidasValue * EP1 + JISU1[1] * (1-EP1);
JISU2 = MidasValue * EP2 + JISU2[1] * (1-EP2);
MACDVal = JiSu1-Jisu2;
MACDsig = MACDVal * EP3 + MACDsig[1] * (1-EP3);
}
function_macd=MACDVal;
// plot2(MACDsig);
// PlotBaseLine1(0);
}
- 1. qq0209.jpg (0.12 MB)
답변 1

예스스탁 예스스탁 답변
2017-02-10 18:09:57
안녕하세요
예스스탁입니다.
해당 내용은 함수화 하시는 것이 의미가 없습니다.
함수로 만드시면 단순 지정한 시간안에만 계산하라는 내용이 됩니다.
차트에 표시가 되는 것을 막지는 목합니다.
즉 사용자 함수자체에서 지표출력의 시간을 막지는 못합니다.
해당 내용으로 다시 지표식을 만들면
지표식에 다시 시간제한 조건을 중복으로 작성해 plot1을 재어해야 합니다.
input:시작년월일(20170208),시작시각(080000);
input:종료년월일(20170208),종료시각(153000);
input: Period1(12),Period2(26),Period3(9);
variables: VolumeValue( 0 ), MedPrice( 0 ), PV( 0 ),StartCalcDate(0),StartTime(0),
CumulativeVolume( 0 ), CumulativePV( 0 ), Started( false ), Denom( 0 ),
KeyCumVol( 0 ), KeyCumPV( 0 ), MidasValue( 0 ),endCalcDate(0),endTime(0) ;
Var : Ep1(0), JISU1(0),Ep2(0), JISU2(0),Ep3(0),Jisu3(0);
var : MACDVal(0),MACDSig(0),ii(0),SD(false),ED(false);
StartCalcDate = 시작년월일;
StartTime = 시작시각;
endCalcDate = 종료년월일;
endTime = 종료시각;
if sdate == StartCalcDate and
(stime == StartTime or (stime > StartTime and stime[1] < StartTime)) Then
Started = true;
if Started == true and sdate == endCalcDate and
(stime >= endTime or (stime > endTime and stime[1]< endTime)) Then
Started = false;
if Started then
{
var1=function_macd(시작년월일,시작시각,종료년월일,종료시각,Period1,Period2,Period3);
plot1(var1);
}
즐거운 하루되세요
> yes 님이 쓴 글입니다.
> 제목 : 부탁 드립니다.
> 도움 주심에 감사 드립니다.
다음 수식을 실행한것과
이것을 함수화 하여 실행 한것이 차이가 있습니다.
그림처럼 함수화 한것의 수평선을 없애고 싶습니다.
미리 감사 드립니다.
input:시작년월일(20170208),시작시각(080000);
input:종료년월일(20170208),종료시각(153000);
input: Period1(12),Period2(26),Period3(9);
variables: VolumeValue( 0 ), MedPrice( 0 ), PV( 0 ),StartCalcDate(0),StartTime(0),
CumulativeVolume( 0 ), CumulativePV( 0 ), Started( false ), Denom( 0 ),
KeyCumVol( 0 ), KeyCumPV( 0 ), MidasValue( 0 ),endCalcDate(0),endTime(0) ;
Var : Ep1(0), JISU1(0),Ep2(0), JISU2(0),Ep3(0),Jisu3(0);
var : MACDVal(0),MACDSig(0),ii(0),SD(false),ED(false);
Ep1 = 2/(Period1+1);
Ep2 = 2/(Period2+1);
Ep3 = 2/(Period3+1);
StartCalcDate = 시작년월일;
StartTime = 시작시각;
endCalcDate = 종료년월일;
endTime = 종료시각;
if sdate == StartCalcDate and
(stime == StartTime or (stime > StartTime and stime[1] < StartTime)) Then
Started = true;
if Started == true and sdate == endCalcDate and
(stime >= endTime or (stime > endTime and stime[1]< endTime)) Then
Started = false;
if Started == true then
{
VolumeValue = iff( DataCompress < 1, Ticks, Volume ) ;
MedPrice = (H + L)/2 ;
PV = MedPrice * VolumeValue ;
CumulativeVolume = VolumeValue + CumulativeVolume ;
CumulativePV = PV + CumulativePV ;
}
if Started == true and Started[1] == false then
{
Started = true ;
Denom = 1 ;
KeyCumVol = CumulativeVolume ;
KeyCumPV = CumulativePV ;
}
else if Denom >= 1 then
Denom = CumulativeVolume - KeyCumVol ;
if Started then
{
if Denom > 1 then
MidasValue = ( CumulativePV - KeyCumPV ) / Denom ;
else if Denom == 1 then
MidasValue = MedPrice ;
ii = ii+1;
if ii <= 1 then {
JISU1 = MidasValue;
JISU2 = MidasValue;
MACDVal = JiSu1-Jisu2;
MACDsig = MACDVal;
}
else{
JISU1 = MidasValue * EP1 + JISU1[1] * (1-EP1);
JISU2 = MidasValue * EP2 + JISU2[1] * (1-EP2);
MACDVal = JiSu1-Jisu2;
MACDsig = MACDVal * EP3 + MACDsig[1] * (1-EP3);
}
plot1(MACDVal);
// plot2(MACDsig);
//PlotBaseLine1(0);
}
함수 실행파일:
input: 시작년월일(20170208),시작시각(080000);
input:종료년월일(20170208),종료시각(153000);
input: Period1(12),Period2(26),Period3(9);
var1=function_macd(시작년월일,시작시각,종료년월일,종료시각,Period1,Period2,Period3);
plot1(var1);
함수명:function_macd
input:시작년월일(numeric),시작시각(numeric);
input:종료년월일(numeric),종료시각(numeric);
input: Period1(numeric),Period2(numeric),Period3(numeric);
variables: VolumeValue( 0 ), MedPrice( 0 ), PV( 0 ),StartCalcDate(0),StartTime(0),
CumulativeVolume( 0 ), CumulativePV( 0 ), Started( false ), Denom( 0 ),
KeyCumVol( 0 ), KeyCumPV( 0 ), MidasValue( 0 ),endCalcDate(0),endTime(0) ;
Var : Ep1(0), JISU1(0),Ep2(0), JISU2(0),Ep3(0),Jisu3(0);
var : MACDVal(0),MACDSig(0),ii(0),SD(false),ED(false);
Ep1 = 2/(Period1+1);
Ep2 = 2/(Period2+1);
Ep3 = 2/(Period3+1);
StartCalcDate = 시작년월일;
StartTime = 시작시각;
endCalcDate = 종료년월일;
endTime = 종료시각;
if sdate == StartCalcDate and
(stime == StartTime or (stime > StartTime and stime[1] < StartTime)) Then
Started = true;
if Started == true and sdate == endCalcDate and
(stime >= endTime or (stime > endTime and stime[1]< endTime)) Then
Started = false;
if Started == true then
{
VolumeValue = iff( DataCompress < 1, Ticks, Volume ) ;
MedPrice = (H + L)/2 ;
PV = MedPrice * VolumeValue ;
CumulativeVolume = VolumeValue + CumulativeVolume ;
CumulativePV = PV + CumulativePV ;
}
if Started == true and Started[1] == false then
{
Started = true ;
Denom = 1 ;
KeyCumVol = CumulativeVolume ;
KeyCumPV = CumulativePV ;
}
else if Denom >= 1 then
Denom = CumulativeVolume - KeyCumVol ;
if Started then
{
if Denom > 1 then
MidasValue = ( CumulativePV - KeyCumPV ) / Denom ;
else if Denom == 1 then
MidasValue = MedPrice ;
ii = ii+1;
if ii <= 1 then {
JISU1 = MidasValue;
JISU2 = MidasValue;
MACDVal = JiSu1-Jisu2;
MACDsig = MACDVal;
}
else{
JISU1 = MidasValue * EP1 + JISU1[1] * (1-EP1);
JISU2 = MidasValue * EP2 + JISU2[1] * (1-EP2);
MACDVal = JiSu1-Jisu2;
MACDsig = MACDVal * EP3 + MACDsig[1] * (1-EP3);
}
function_macd=MACDVal;
// plot2(MACDsig);
// PlotBaseLine1(0);
}
다음글
이전글